Fig. B.3.
Download original image
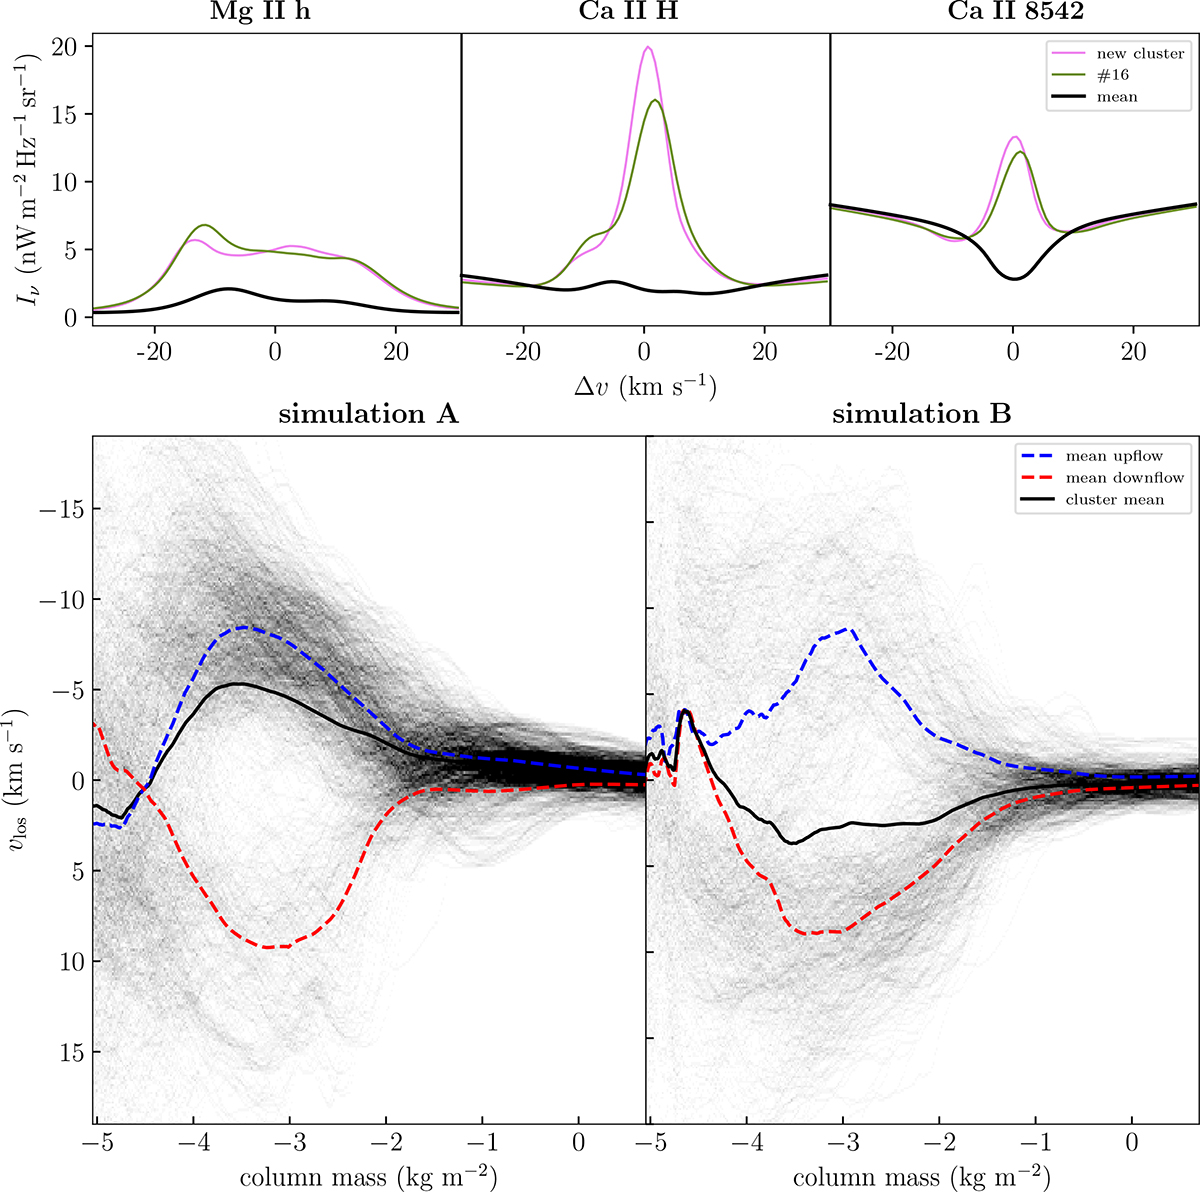
Line-of-sight velocities from a redshifted cluster in emission, from a k-means model with 100 clusters. Top row: representative profile of the new cluster (violet lines) compared to cluster 16 (green lines) in the results. The solid black lines are the mean spectra. Bottom row: Distribution of line-of-sight velocities from each pixel in the new cluster. In the line-of-sight velocity, there are two common distributions: one with down-flows and one with up-flows. The blue and red dashed lines are averages of the up-flows and down-flows, respectively. The solid black line is the average velocity of the cluster.
Current usage metrics show cumulative count of Article Views (full-text article views including HTML views, PDF and ePub downloads, according to the available data) and Abstracts Views on Vision4Press platform.
Data correspond to usage on the plateform after 2015. The current usage metrics is available 48-96 hours after online publication and is updated daily on week days.
Initial download of the metrics may take a while.