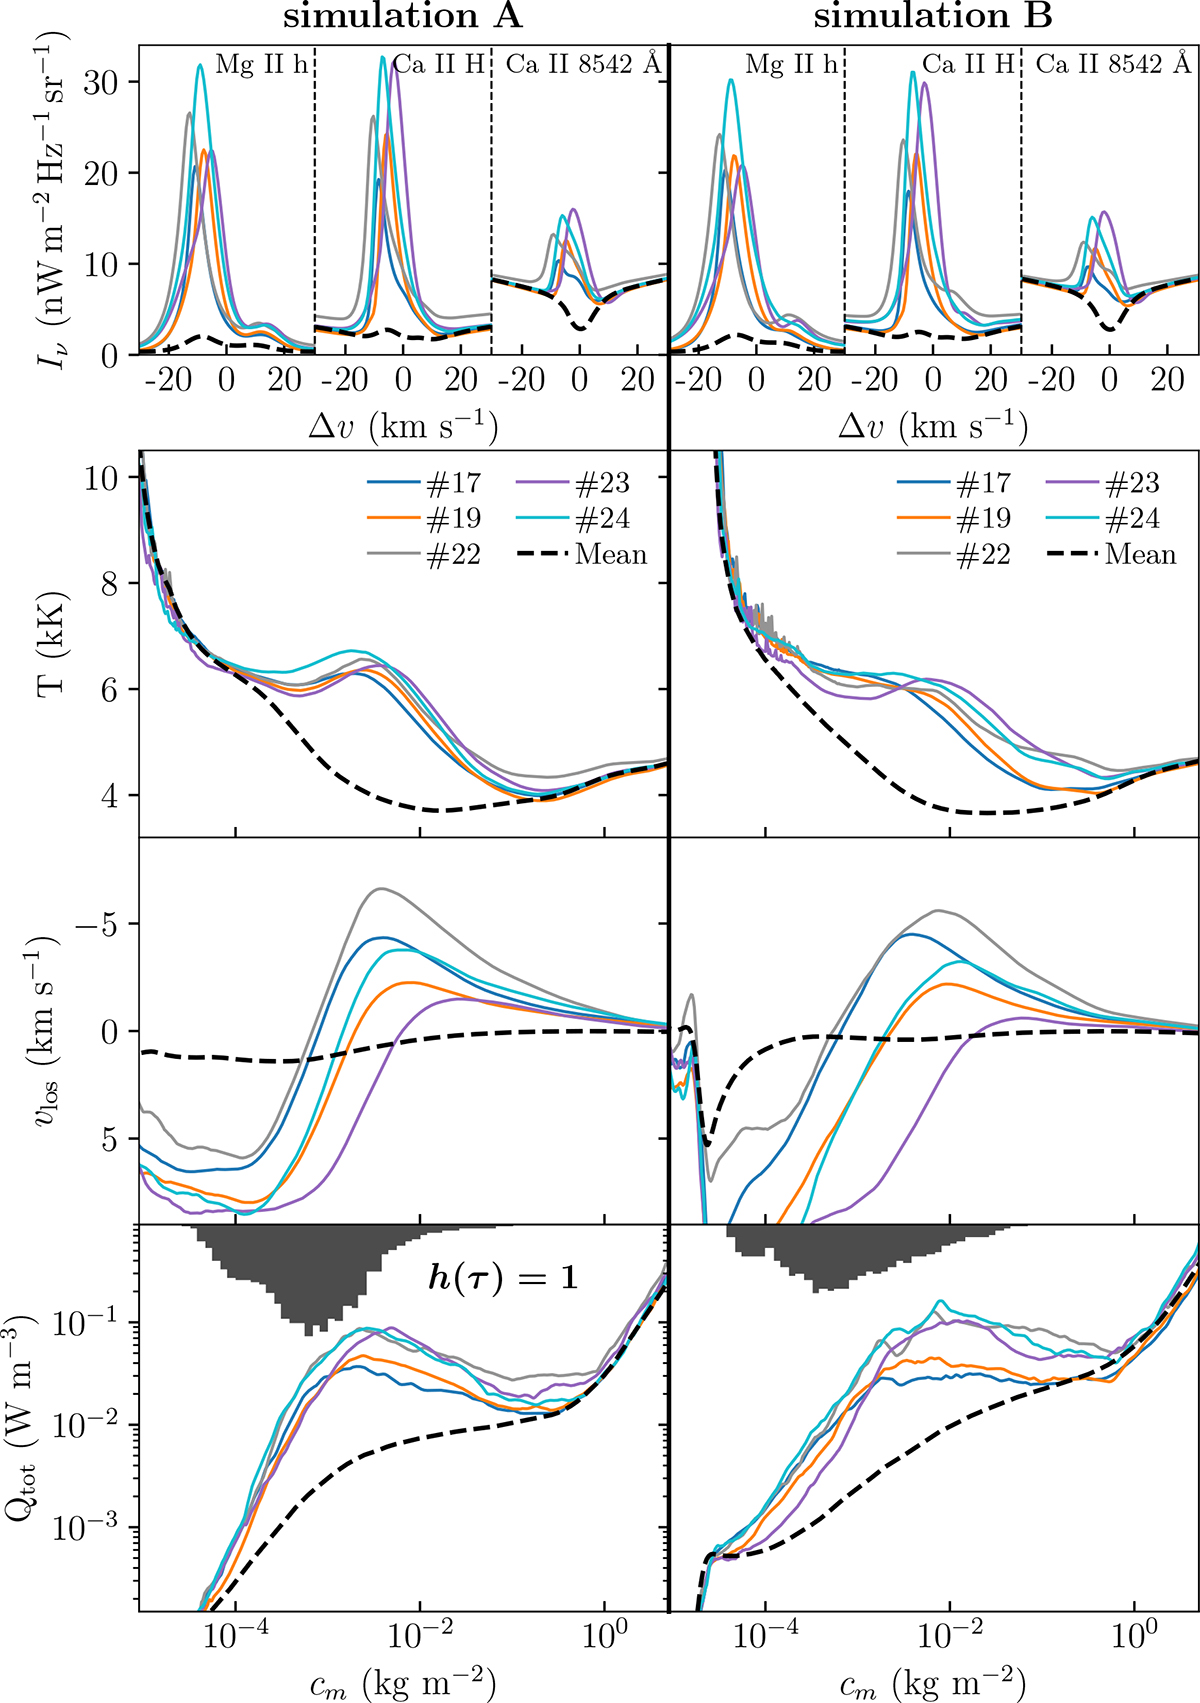
Fig. 2.
Download original image
Atmospheric profiles for the clusters with high emission in the blue wing of the representative profiles. The columns are split into the two different simulations (left: simulation A, right: simulation B). Top row: Average spectra of the clusters. Bottom three rows: Average atmospheric quantities in the clusters. From the top, they are the gas temperature, line-of-sight velocity, and total dissipative heating (Qviscous + Qjoule). The dashed black lines show the averages for the entire simulations. The distribution in the bottom row is the column mass of the blue emission clusters where τν equals unity for the inner blue wing (−5.4 km s−1) of Ca II H.
Current usage metrics show cumulative count of Article Views (full-text article views including HTML views, PDF and ePub downloads, according to the available data) and Abstracts Views on Vision4Press platform.
Data correspond to usage on the plateform after 2015. The current usage metrics is available 48-96 hours after online publication and is updated daily on week days.
Initial download of the metrics may take a while.