Open Access
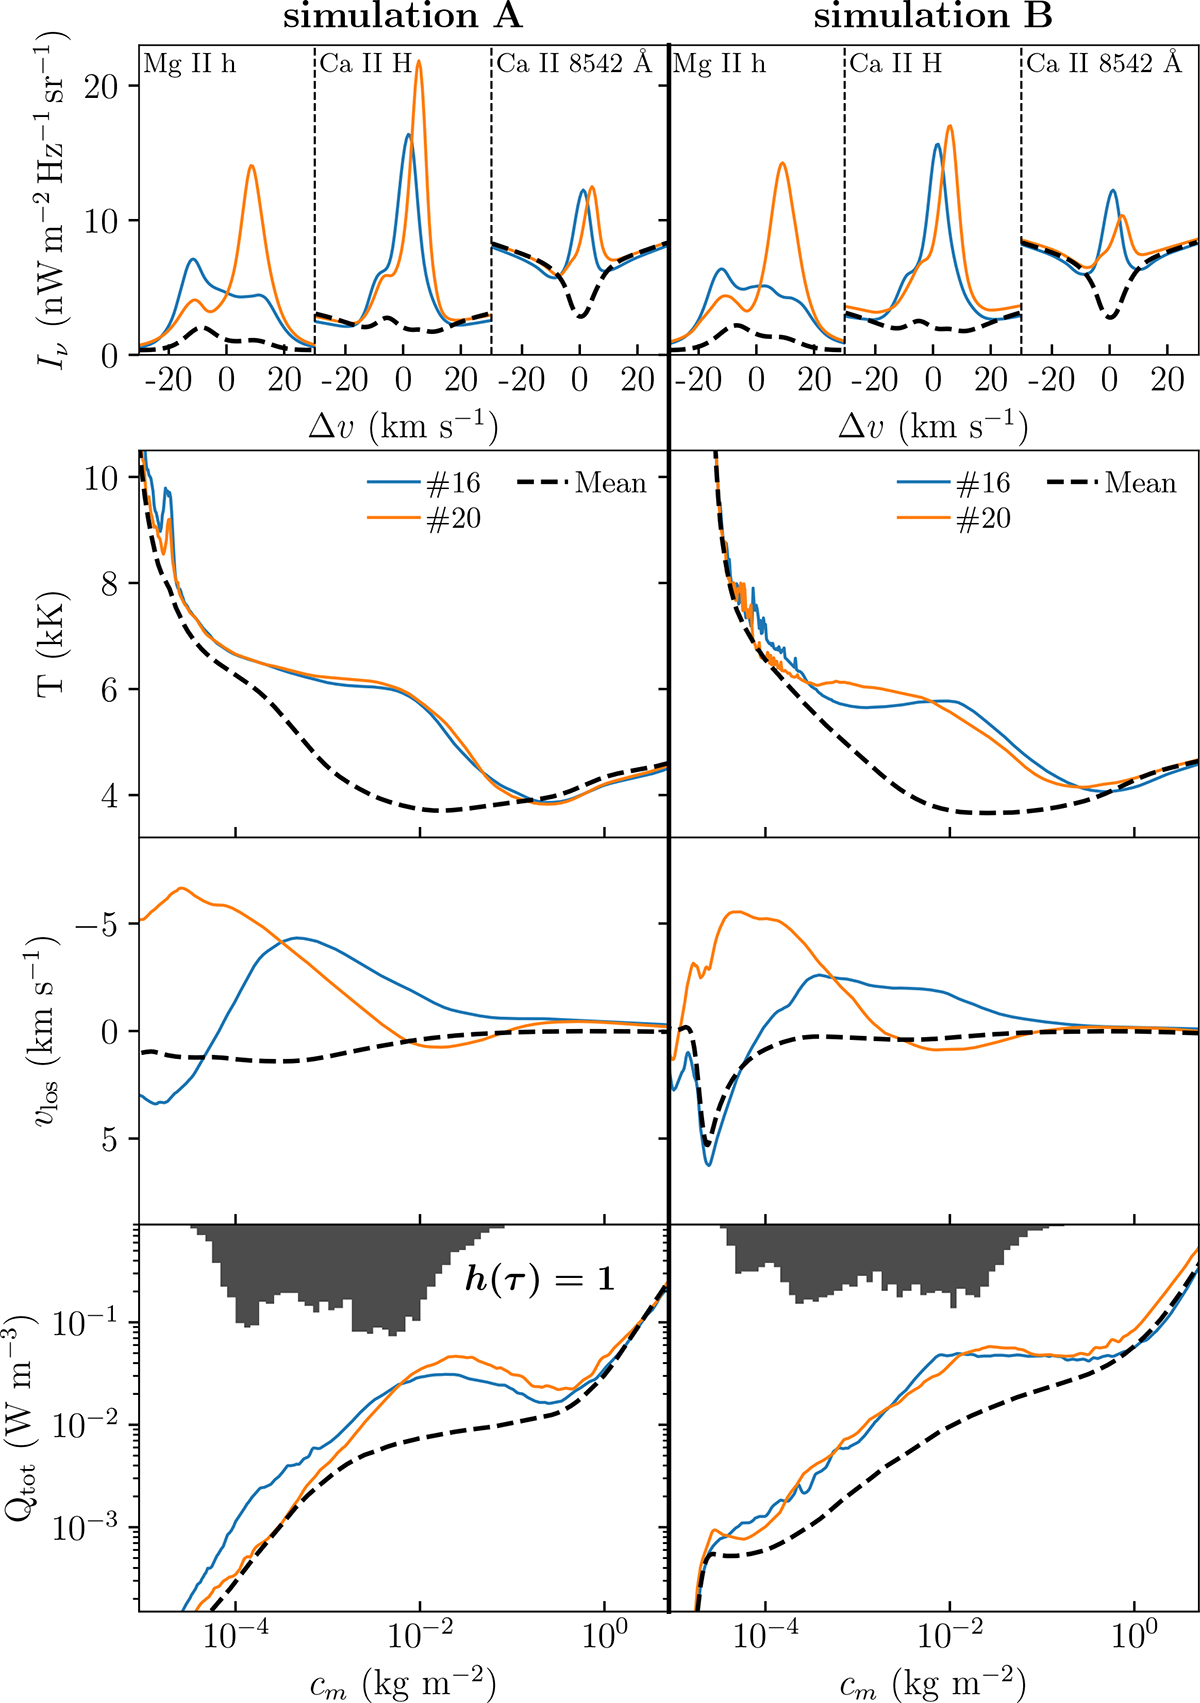
Fig. 3.
Download original image
Atmospheric profiles for the clusters with high emission in the red wing of the representative profiles. See caption of Fig. 2. Here, the distribution in the bottom row is the column mass of the red emission clusters where τν equals unity for the inner red wing (5.4 km s−1) of Ca II H.
Current usage metrics show cumulative count of Article Views (full-text article views including HTML views, PDF and ePub downloads, according to the available data) and Abstracts Views on Vision4Press platform.
Data correspond to usage on the plateform after 2015. The current usage metrics is available 48-96 hours after online publication and is updated daily on week days.
Initial download of the metrics may take a while.