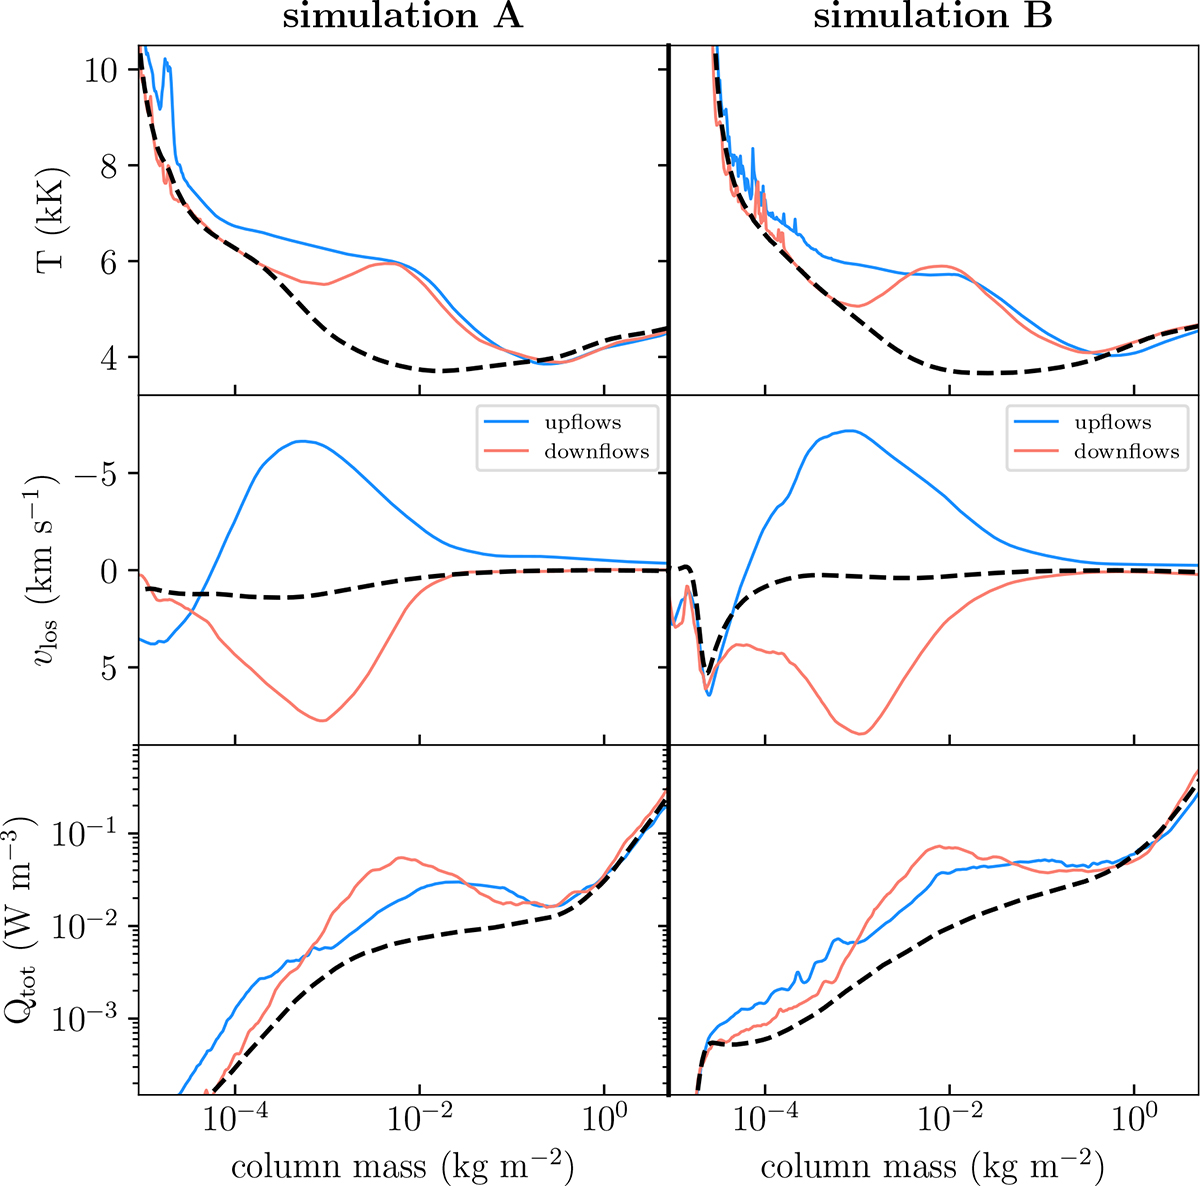
Fig. 4.
Download original image
Two typical atmospheres for cluster 16: one atmosphere with down-flow and one with up-flow in the chromosphere. The blue lines are average quantities for all pixels with a negative line-of-sight velocity at cm = 10−3 and the red lines are average quantities for all pixels with a positive line-of-sight velocity at the same column mass. We show the τ = 1 distributions for the up-flowing (blue) and down-flowing (red) at a Doppler velocity of +5.4 km s−1 for the Ca II H line.
Current usage metrics show cumulative count of Article Views (full-text article views including HTML views, PDF and ePub downloads, according to the available data) and Abstracts Views on Vision4Press platform.
Data correspond to usage on the plateform after 2015. The current usage metrics is available 48-96 hours after online publication and is updated daily on week days.
Initial download of the metrics may take a while.