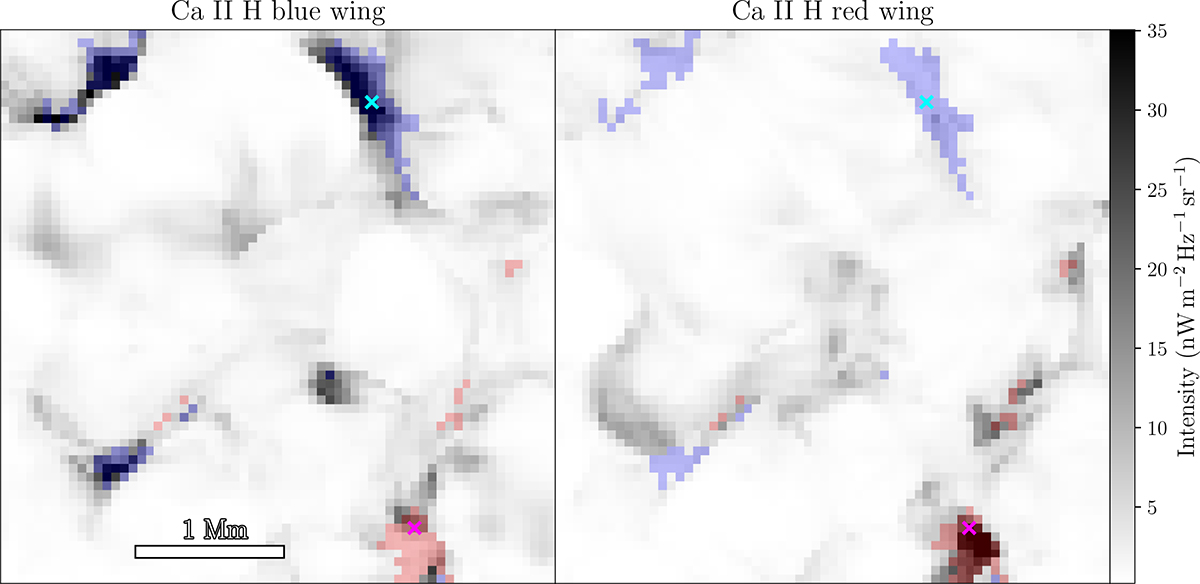
Fig. 6.
Download original image
Images of the Ca II H blue wing at −5 km s−1 and red wing at +5 km s−1 from simulation A. Overplotted on the images are locations where the pixels belong to a cluster with strong blue emission (cluster 14, 15, 17, 19, 22, 23, and 24) in blue or strong red emission (cluster 16 and 20) in red. The cyan and magenta crosses are placed on locations with especially strong blue or red emission, respectively. The pixel marked with cyan belongs to cluster 24, and the pixel marked with magenta belongs to cluster 20. Spectrograms from these pixels can be seen in Fig. 7.
Current usage metrics show cumulative count of Article Views (full-text article views including HTML views, PDF and ePub downloads, according to the available data) and Abstracts Views on Vision4Press platform.
Data correspond to usage on the plateform after 2015. The current usage metrics is available 48-96 hours after online publication and is updated daily on week days.
Initial download of the metrics may take a while.