Fig. 7.
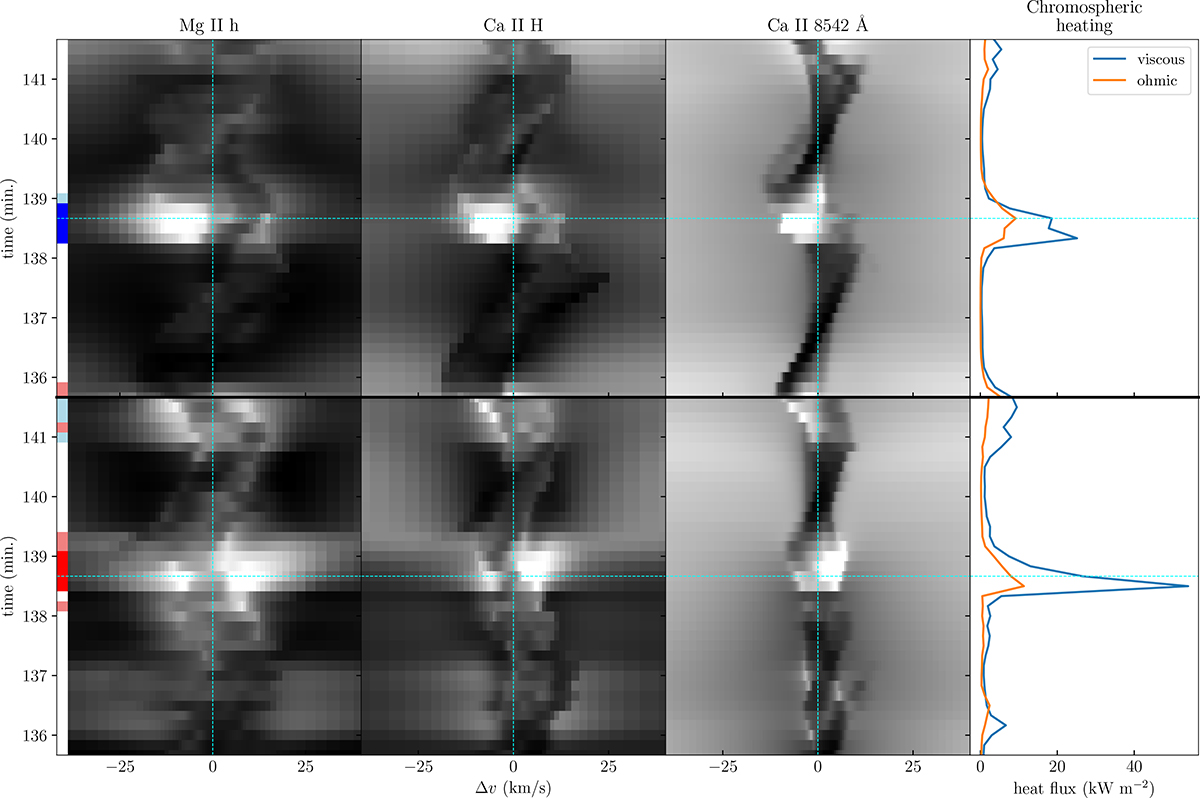
Download original image
Spectrograms of two heating events from simulation A. Top row: bright blue grain from the pixel that is marked with a cyan cross in Fig. 6. Bottom row: bright red grain from the pixel that is marked with a magenta cross in Fig. 6. Both events display an excess of chromospheric heating, shown in the column to the right. The spectrograms are scaled non-linearly with a γ factor to enhance contrast. For Mg II h and Ca II H, γ = 1/4; for Ca II 8542 Å, γ = 1/2. The left inset in the spectrograms shows the cluster class of the spectra at a given time-step: blue and red colours correspond to blue and red grains; light blue and light red colours correspond to clusters where the Ca II lines show weaker emission.
Current usage metrics show cumulative count of Article Views (full-text article views including HTML views, PDF and ePub downloads, according to the available data) and Abstracts Views on Vision4Press platform.
Data correspond to usage on the plateform after 2015. The current usage metrics is available 48-96 hours after online publication and is updated daily on week days.
Initial download of the metrics may take a while.