Fig. 1
Download original image
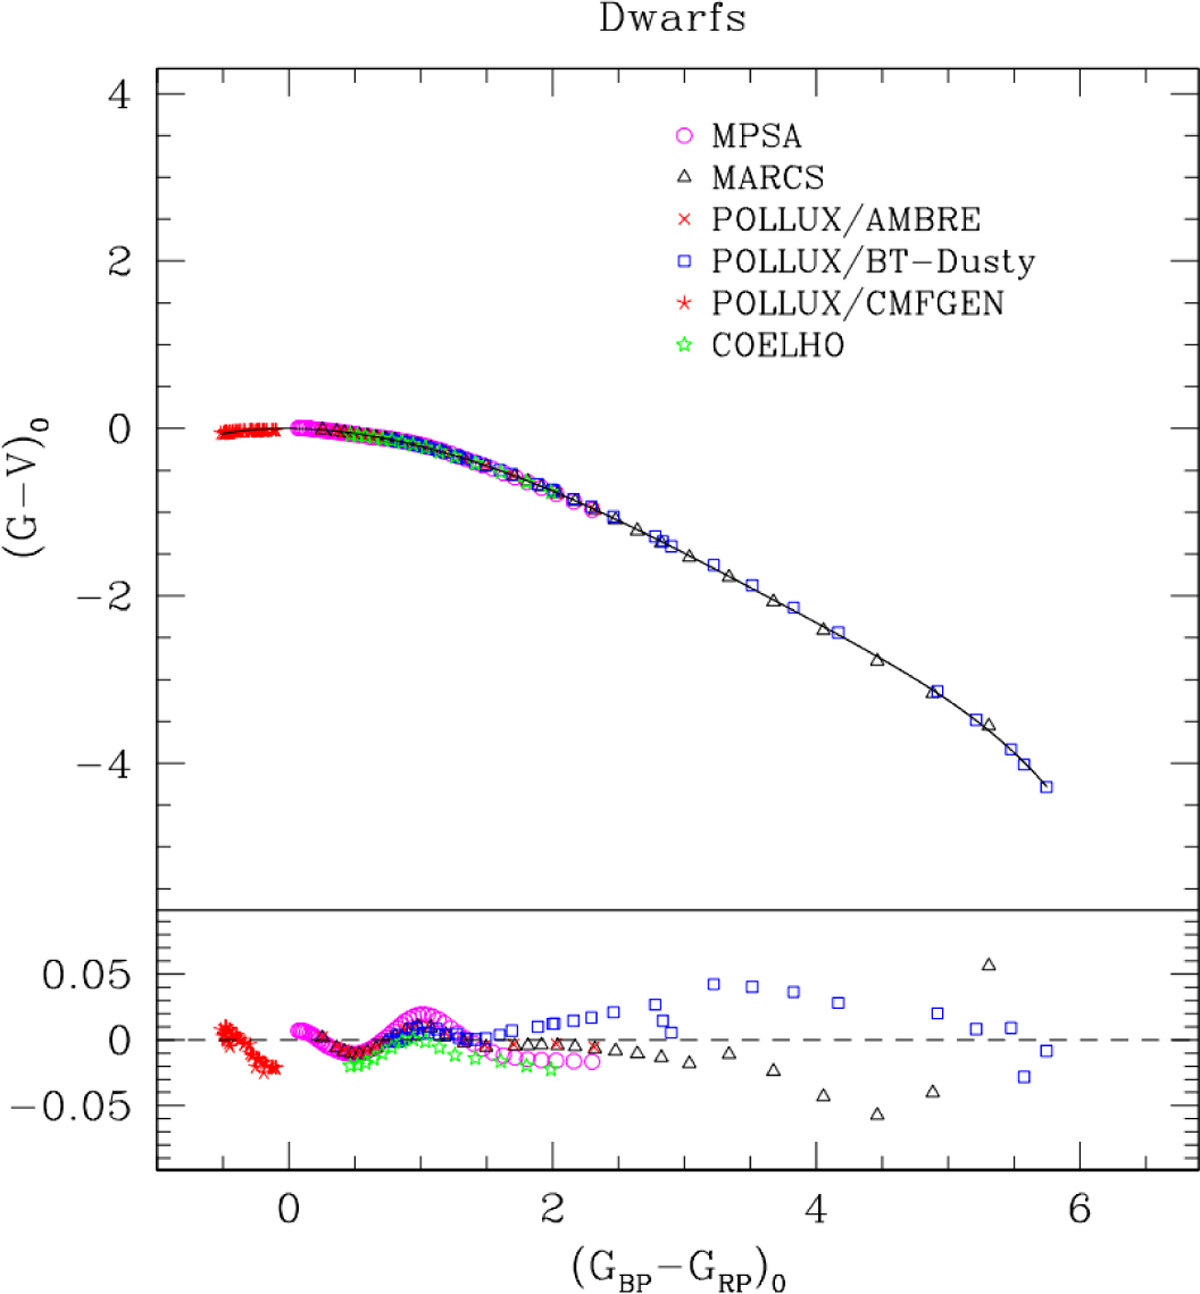
Top : synthetic two-colour diagram of (G - V)0 vs (GBP - GRP)0 for dwarf star models taken from the stellar libraries indicated in the legend. The solid line represents the best-fit polynomial to the synthetic colours. Bottom : residuals between the synthetic (G - V)0 values and the best-fit relation, plotted as a function of the synthetic (GBP - GRP)0 colour.
Current usage metrics show cumulative count of Article Views (full-text article views including HTML views, PDF and ePub downloads, according to the available data) and Abstracts Views on Vision4Press platform.
Data correspond to usage on the plateform after 2015. The current usage metrics is available 48-96 hours after online publication and is updated daily on week days.
Initial download of the metrics may take a while.