Fig. 11
Download original image
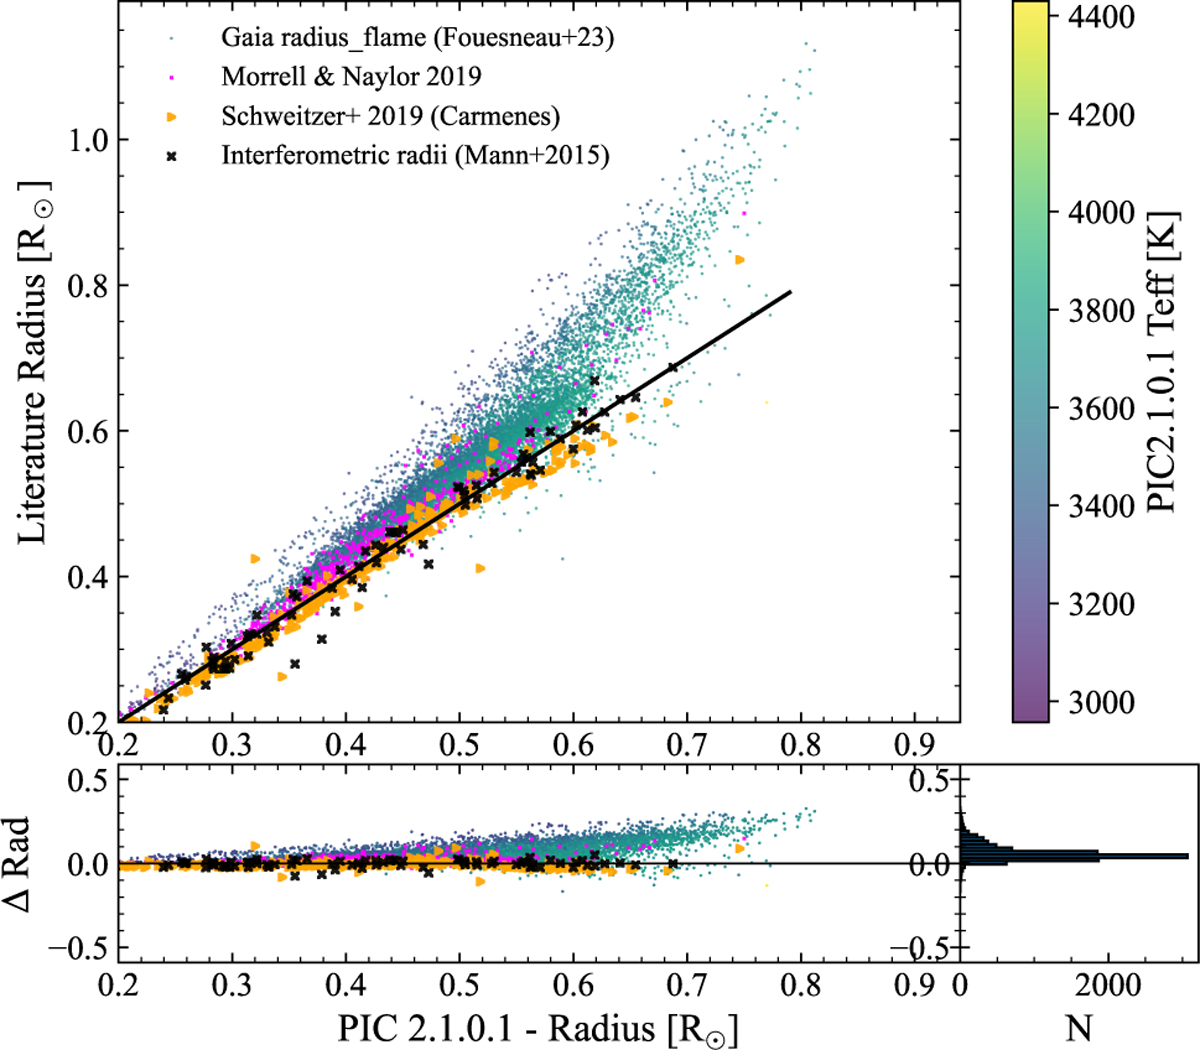
Comparison of stellar radii from different sources. Top : comparison between P4 radii estimated in this work (x-axis) and the radius_flame values from Gaia DR3 (y-axis), shown with a colour map representing the effective temperature. The radii from other literature works are also shown. The solid line is the 1:1 relation. Bottom : distribution of the differences between the P4 radii and Gaia DR3 radius_flame values and other external literature estimates.
Current usage metrics show cumulative count of Article Views (full-text article views including HTML views, PDF and ePub downloads, according to the available data) and Abstracts Views on Vision4Press platform.
Data correspond to usage on the plateform after 2015. The current usage metrics is available 48-96 hours after online publication and is updated daily on week days.
Initial download of the metrics may take a while.