Open Access
Fig. 2
Download original image
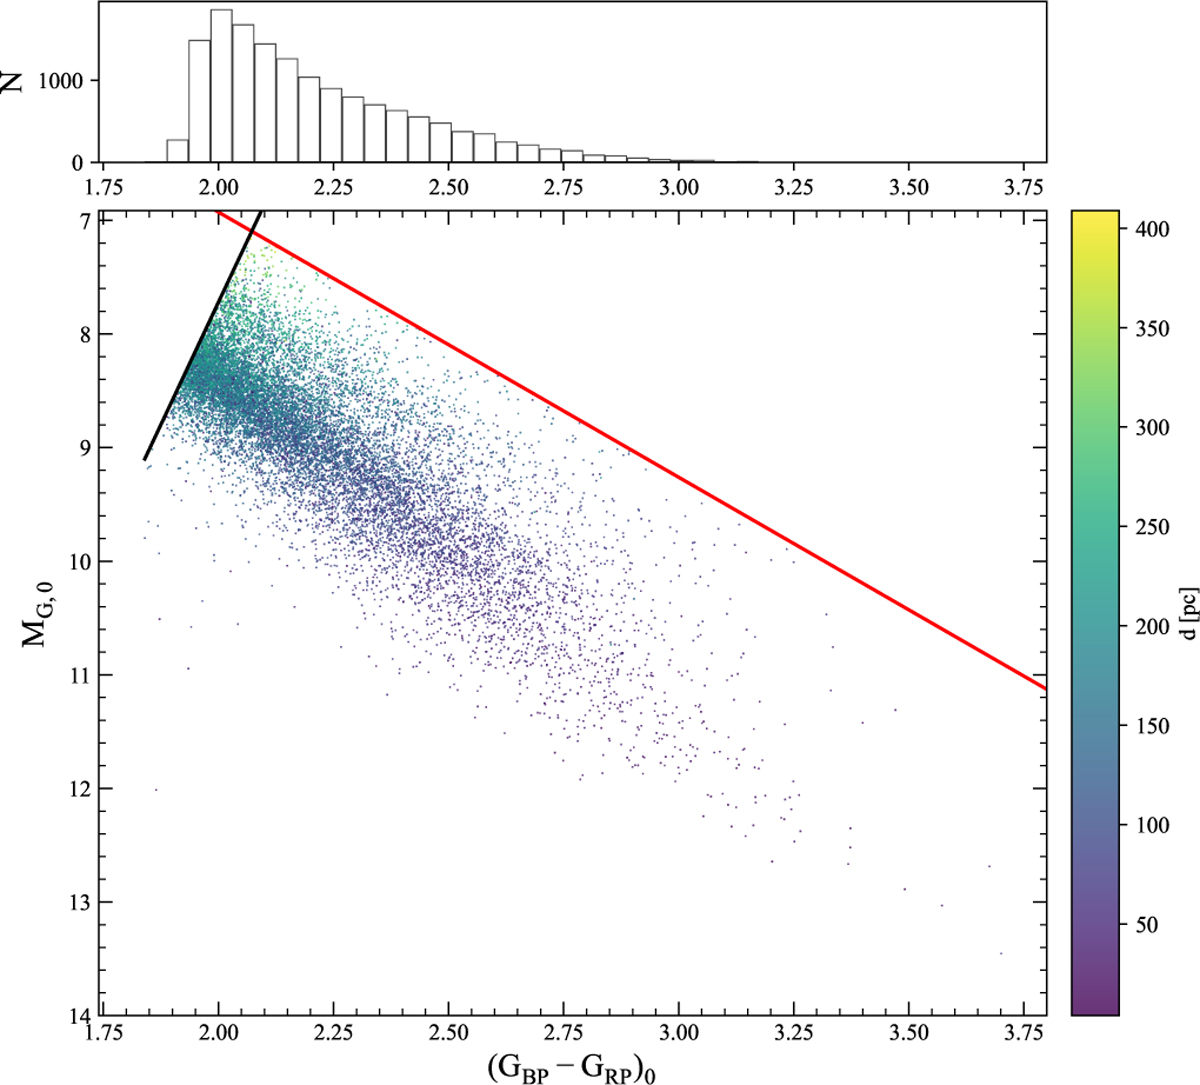
Colour-absolute magnitude diagram of the P4 sample targets. The colour map indicates the distance of the targets. The black and red lines represent the adopted limits indicated by the first two relations given in Eq. (2). The histogram of the (GBP - GRP)0 colours is also shown in the top panel.
Current usage metrics show cumulative count of Article Views (full-text article views including HTML views, PDF and ePub downloads, according to the available data) and Abstracts Views on Vision4Press platform.
Data correspond to usage on the plateform after 2015. The current usage metrics is available 48-96 hours after online publication and is updated daily on week days.
Initial download of the metrics may take a while.