Fig. 4
Download original image
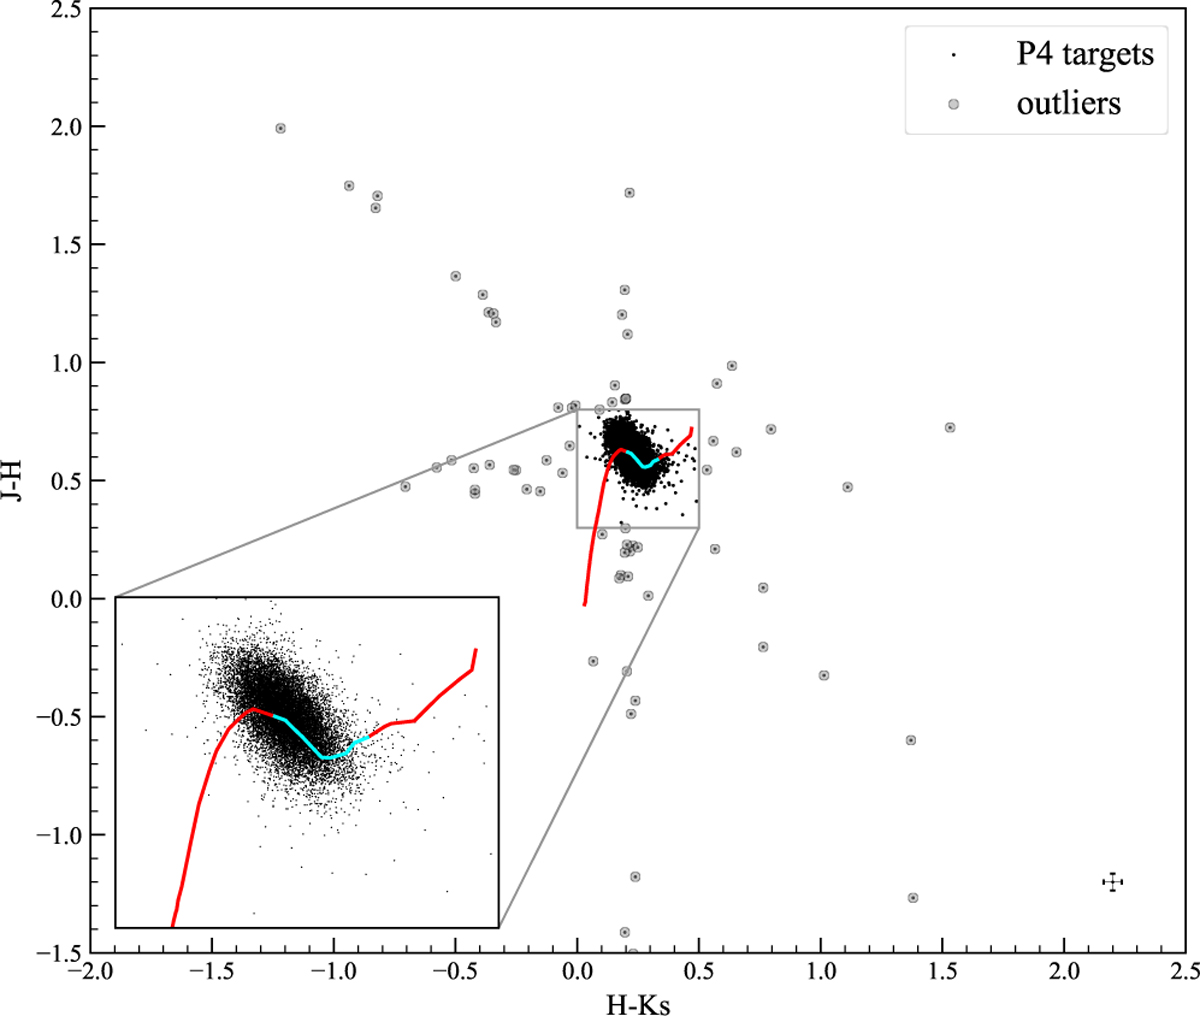
Near-infrared (J-H vs H-Ks) colour-colour diagram of the P4 sample targets. The grey circles highlight the outliers in this diagram. The solid red line shows the mean colours of dwarfs from Pecaut & Mamajek (2013). The cyan line indicates the subset of stars from M0V to M6V. The inset provides a zoomed-in view of the high-density core of the distribution, allowing better visualisation of the main-sequence locus. The typical errors in the colours are indicated in the bottom right corner.
Current usage metrics show cumulative count of Article Views (full-text article views including HTML views, PDF and ePub downloads, according to the available data) and Abstracts Views on Vision4Press platform.
Data correspond to usage on the plateform after 2015. The current usage metrics is available 48-96 hours after online publication and is updated daily on week days.
Initial download of the metrics may take a while.