Fig. 5
Download original image
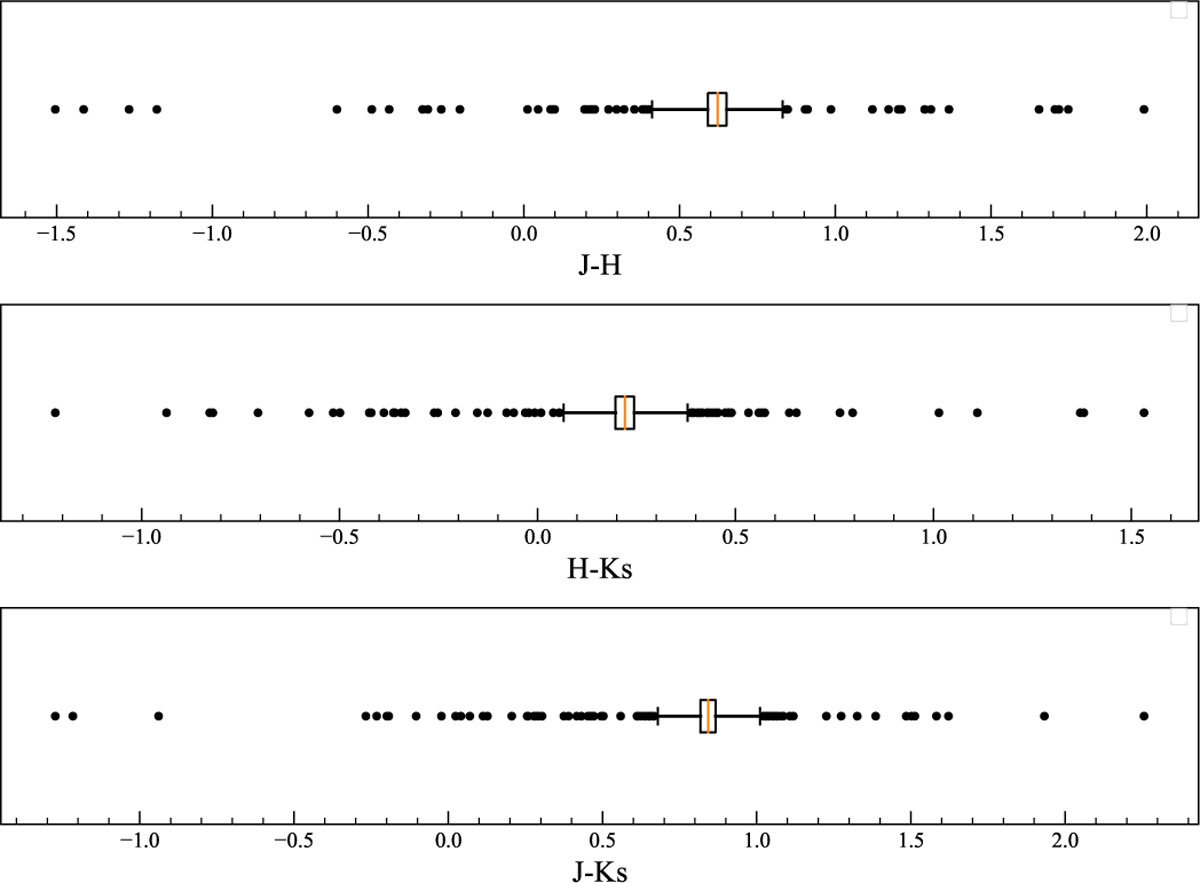
Boxplots of the J - H, H - KS, and J - KS colour distributions for the selected P4 sample. Each box represents the IQR (25th to 75th percentile), with the central red line indicating the median. The whiskers extend to the most extreme data points that are not considered outliers. The individual points beyond the whiskers represent outliers, i.e. values that deviate significantly from the main distribution.
Current usage metrics show cumulative count of Article Views (full-text article views including HTML views, PDF and ePub downloads, according to the available data) and Abstracts Views on Vision4Press platform.
Data correspond to usage on the plateform after 2015. The current usage metrics is available 48-96 hours after online publication and is updated daily on week days.
Initial download of the metrics may take a while.