Open Access
Fig. 6
Download original image
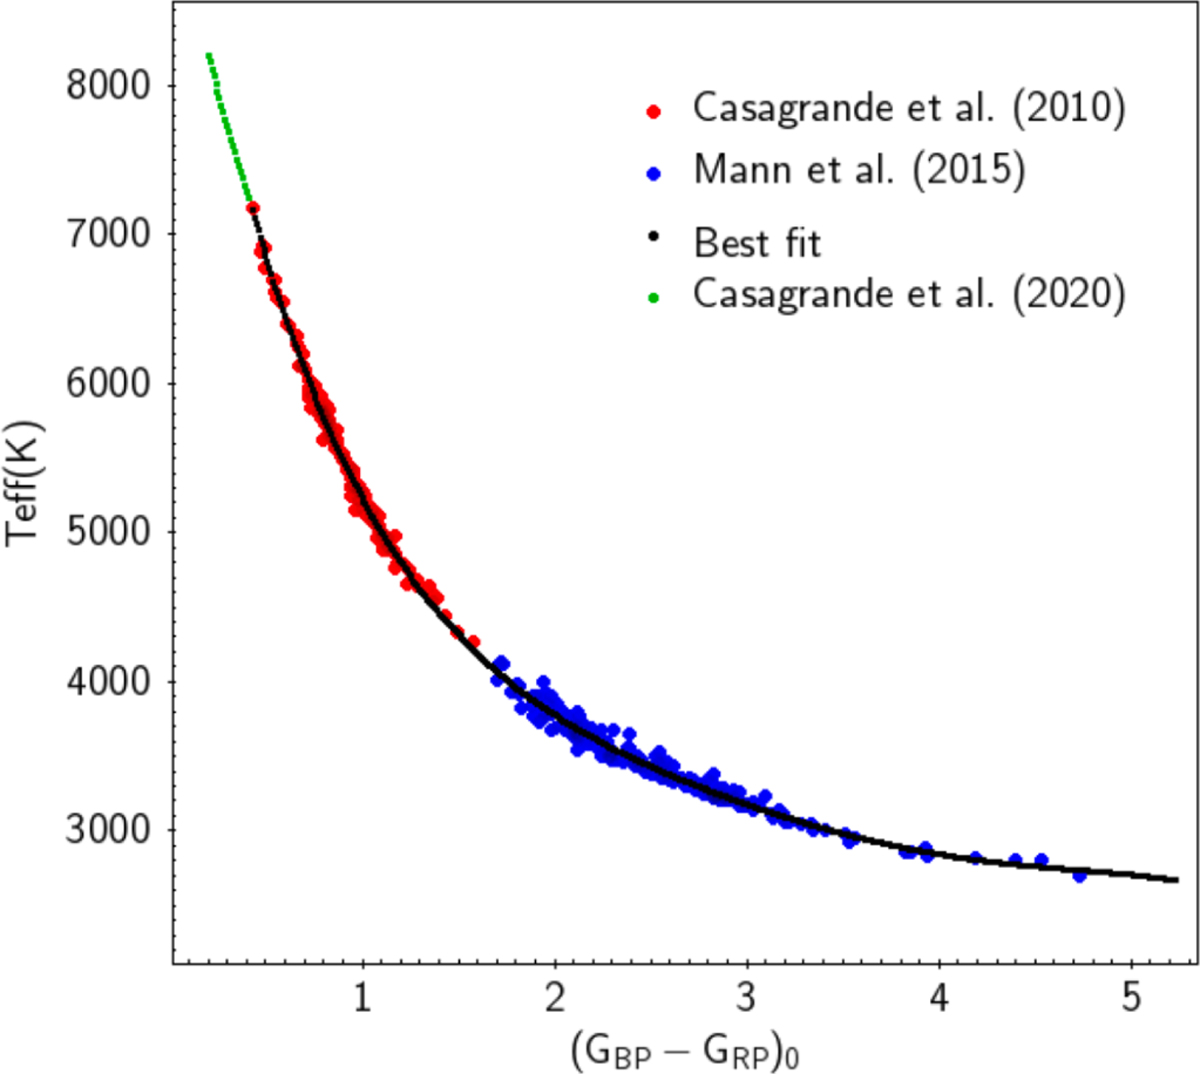
Best-fit relationship between effective temperature and colour (Eq. (3), black solid line). The red points represent the sample of Casagrande et al. (2010), while the blue points are the sample of Mann et al. (2015). The green line represents Eq. (1) in Casagrande et al. (2021) where we imposed log g=4.438068 and [Fe∕H]=0.
Current usage metrics show cumulative count of Article Views (full-text article views including HTML views, PDF and ePub downloads, according to the available data) and Abstracts Views on Vision4Press platform.
Data correspond to usage on the plateform after 2015. The current usage metrics is available 48-96 hours after online publication and is updated daily on week days.
Initial download of the metrics may take a while.