Fig. 8
Download original image
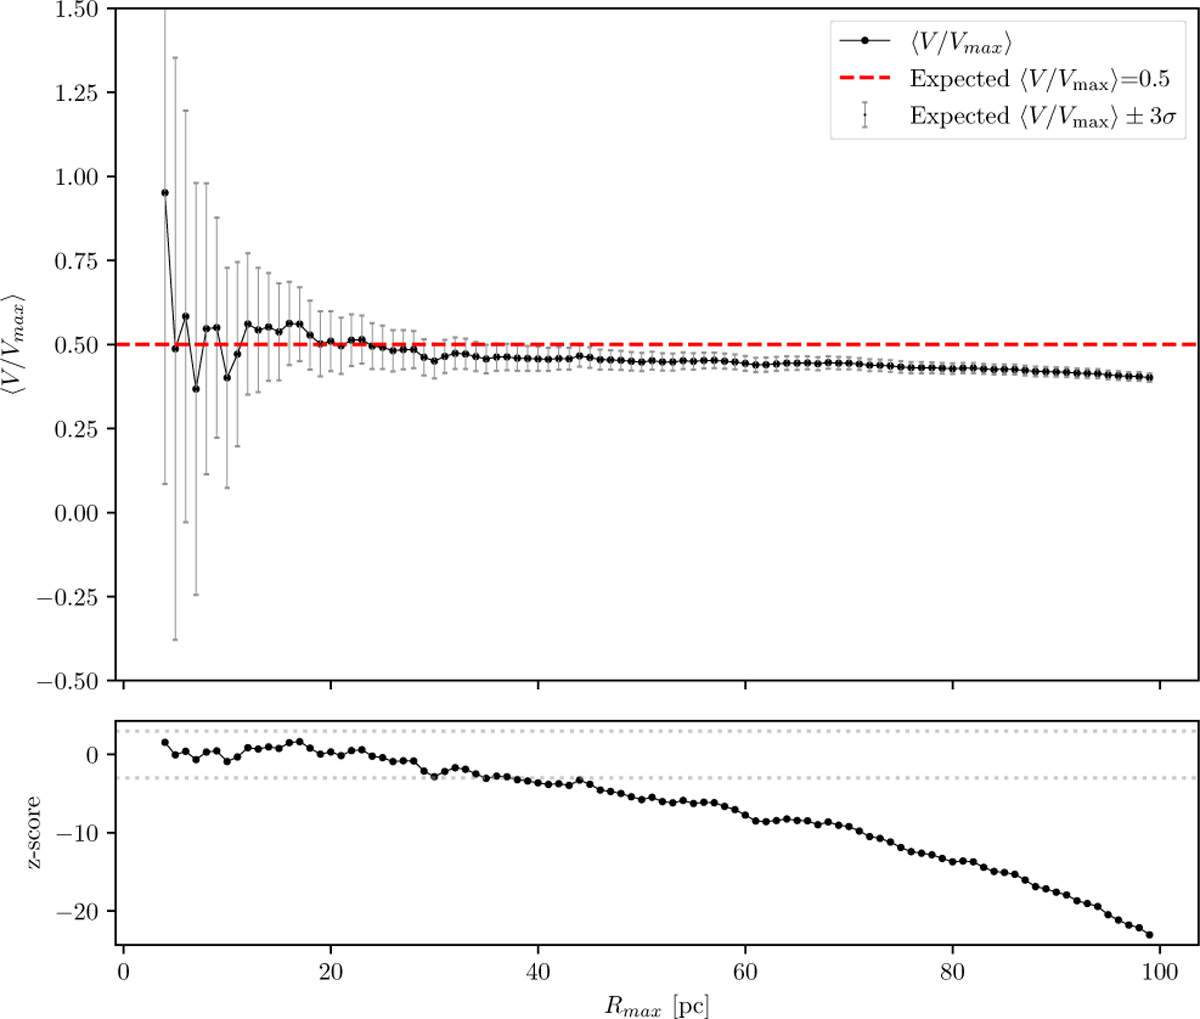
Top : 〈V/Vmal〉 as a function of Rmax for the P4 targets with 7 ≤ MG,0 ≤ 14, where Vmax is the corresponding maximum volume. The red dashed line indicates the expected value of 0.5, and the grey error bars show the 3σ statistical uncertainty. Bottom : z-score of the deviation from the expected 0.5 value, defined as z = (〈V/Vmax〉 - 0.5)/σ, as a function of Rmax. The horizontal dotted grey lines indicate the ±3σ limits used to assess the completeness of the sample.
Current usage metrics show cumulative count of Article Views (full-text article views including HTML views, PDF and ePub downloads, according to the available data) and Abstracts Views on Vision4Press platform.
Data correspond to usage on the plateform after 2015. The current usage metrics is available 48-96 hours after online publication and is updated daily on week days.
Initial download of the metrics may take a while.