Fig. 10
Download original image
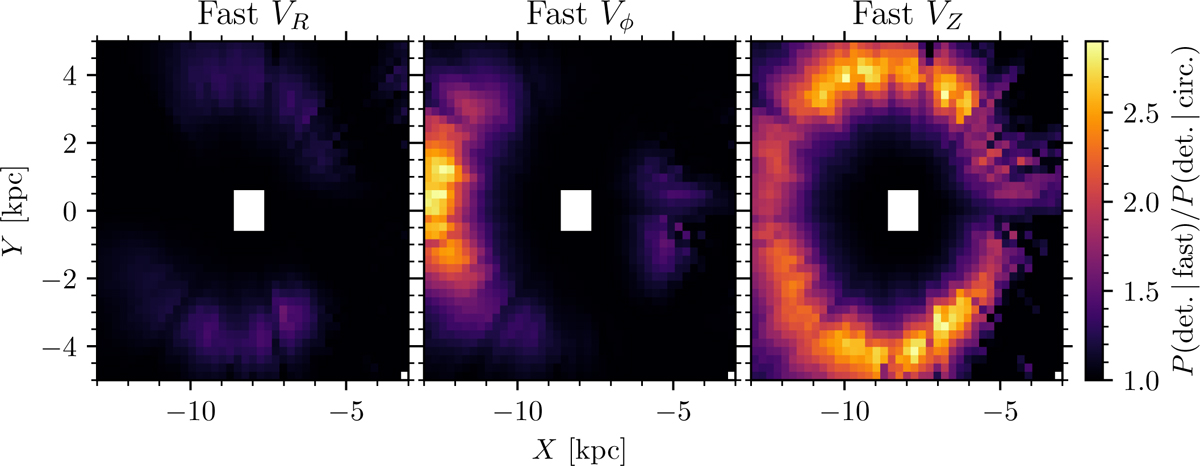
Impact of cluster detectability from clusters being on non-circular orbits, shown for the same cluster as in Fig. 9 and plotted in the same coordinate system. From left to right, plots show the factor by which cluster detection probability is increased by applying a 25 km/s boost to cluster orbital speed in the radial (left), ϕ (centre), and Z (right) directions, averaged from z = −100 pc to z = 100 pc. The white region in the middle is for distances lower than 500 pc (which were not considered in this study).
Current usage metrics show cumulative count of Article Views (full-text article views including HTML views, PDF and ePub downloads, according to the available data) and Abstracts Views on Vision4Press platform.
Data correspond to usage on the plateform after 2015. The current usage metrics is available 48-96 hours after online publication and is updated daily on week days.
Initial download of the metrics may take a while.