Open Access
Fig. A.1
Download original image
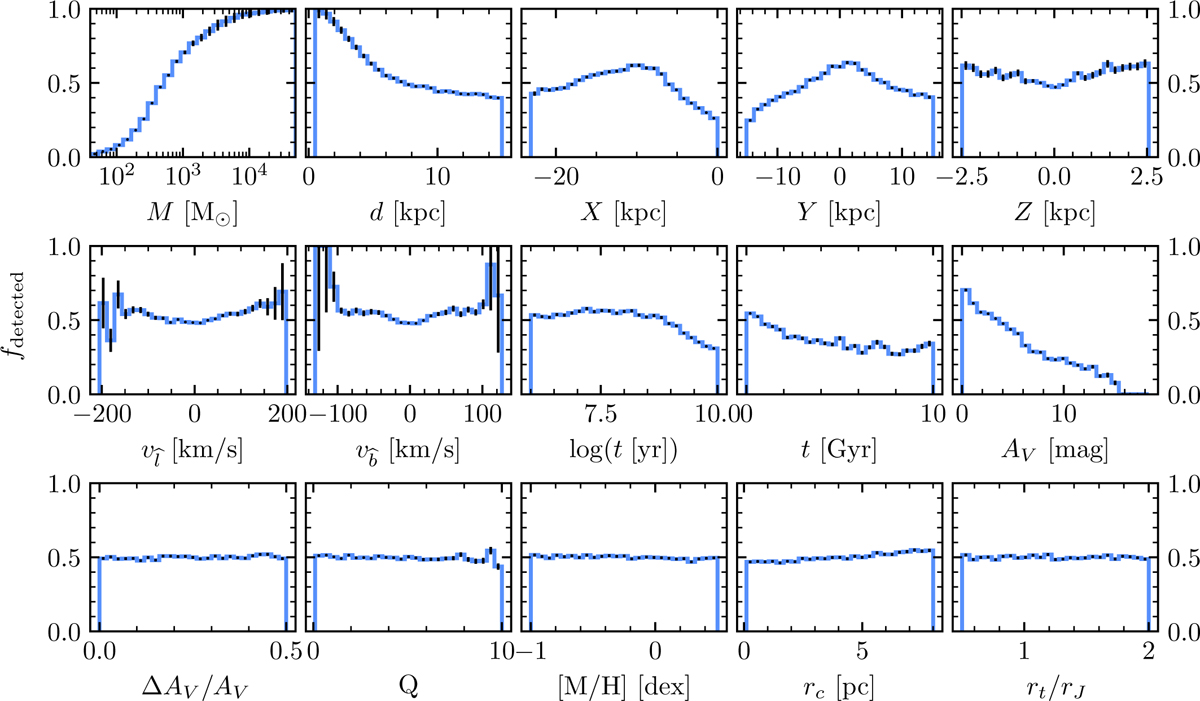
Binned fraction of clusters detected at different parameter values for the sample of all 79 720 injected and retrieved clusters. Poisson errors on bins are shown by the black bars.
Current usage metrics show cumulative count of Article Views (full-text article views including HTML views, PDF and ePub downloads, according to the available data) and Abstracts Views on Vision4Press platform.
Data correspond to usage on the plateform after 2015. The current usage metrics is available 48-96 hours after online publication and is updated daily on week days.
Initial download of the metrics may take a while.