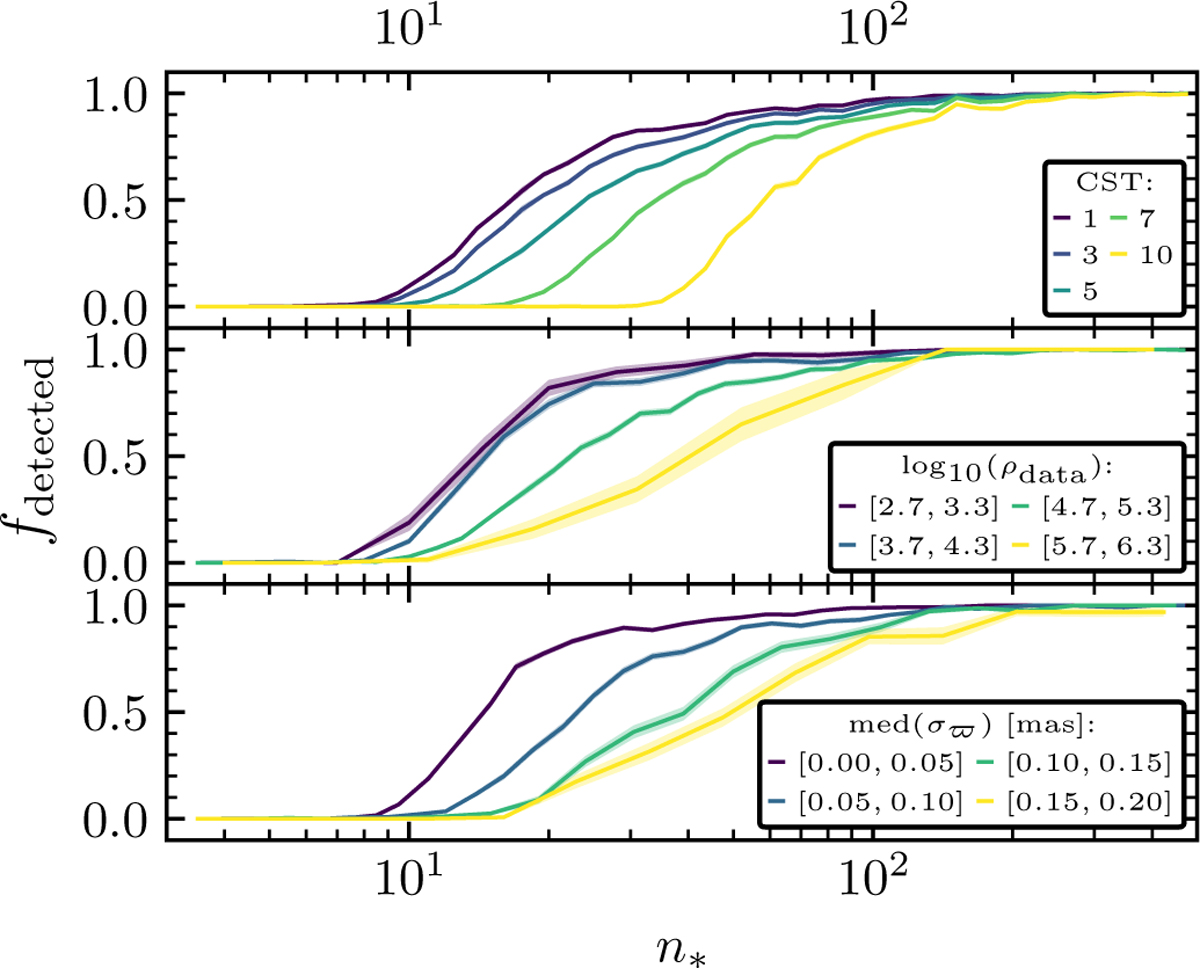
Fig. A.2
Download original image
Effect of varying cluster sample on the fraction of clusters detected against the number of injected member stars, n*. Different samples are indicated by the different coloured curves, with the shaded region showing standard error. In the upper panel, CST threshold is varied. In the middle panel, only injected clusters at certain Gaia data densities ρdata are shown. In the lower panel, clusters are divided into different samples based on the median parallax error of their simulated member stars.
Current usage metrics show cumulative count of Article Views (full-text article views including HTML views, PDF and ePub downloads, according to the available data) and Abstracts Views on Vision4Press platform.
Data correspond to usage on the plateform after 2015. The current usage metrics is available 48-96 hours after online publication and is updated daily on week days.
Initial download of the metrics may take a while.