Fig. E.1
Download original image
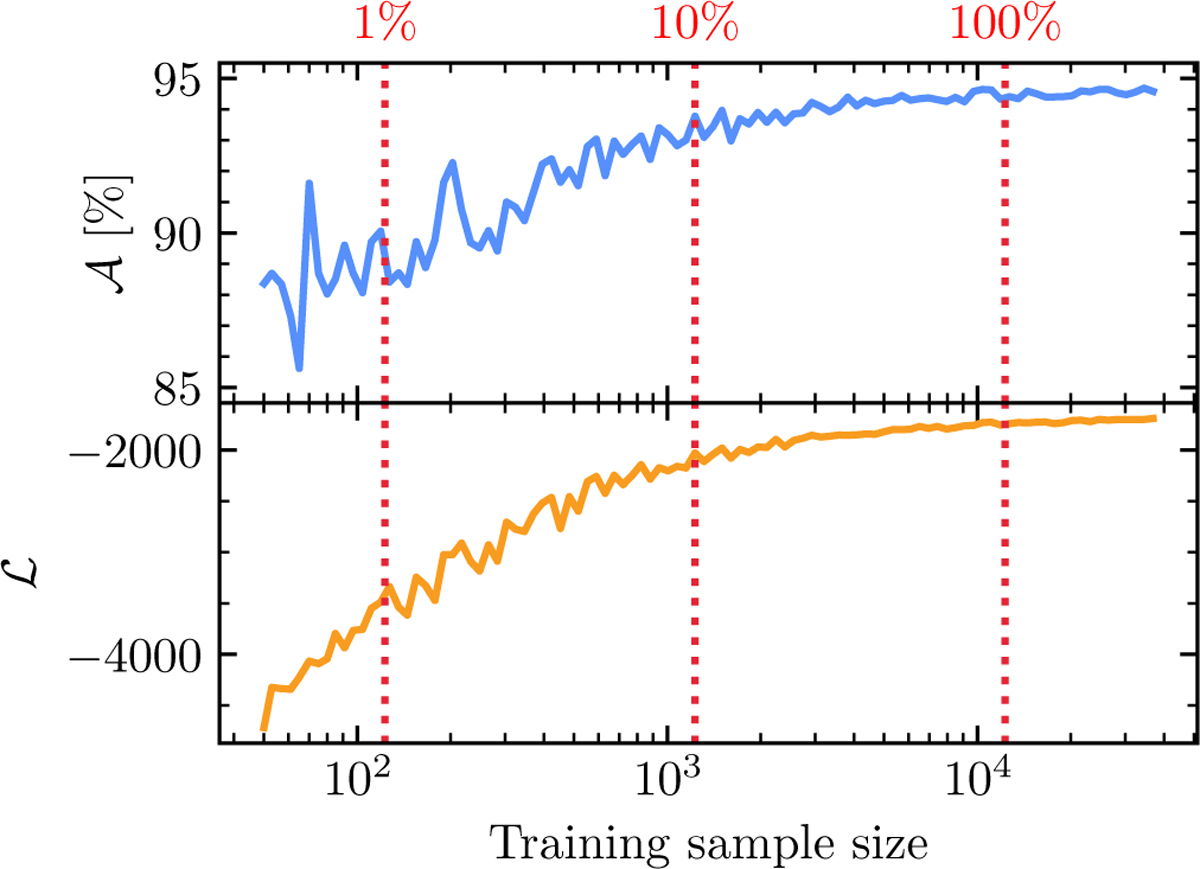
Effect of training data sample size on the test data accuracy (upper plot) and test data log loss (bottom plot) of an XGBoost model trained to predict cluster detectability from n∗, τ, med(σϖ), and ρdata, as in Sect. 3.2. Red dashed lines, with corresponding labels at the top of the plot, show the size of the training sample as a fraction of the total number of clusters in HR23.
Current usage metrics show cumulative count of Article Views (full-text article views including HTML views, PDF and ePub downloads, according to the available data) and Abstracts Views on Vision4Press platform.
Data correspond to usage on the plateform after 2015. The current usage metrics is available 48-96 hours after online publication and is updated daily on week days.
Initial download of the metrics may take a while.