Fig. 2
Download original image
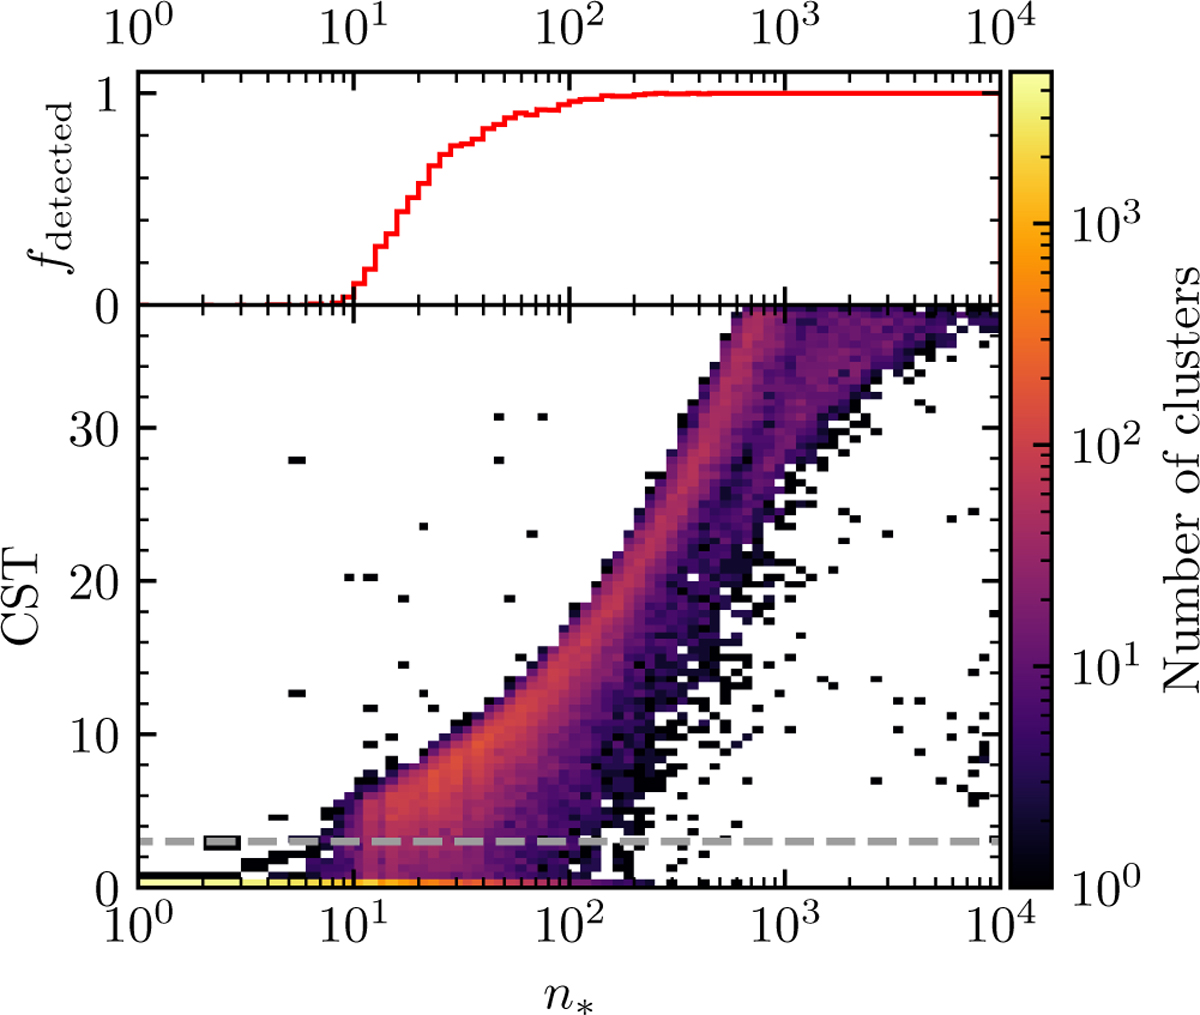
Top: binned mean of fdetected against number of simulated stars injected into Gaia data for simulated clusters in this study. See also Fig. A.2 for more examples of the logistic dependence of fdetected on n∗. Bottom: 2D histogram of CST against number of injected stars for simulated clusters. The number of clusters at a given point is shown by the logarithmic colour-scale. The dashed grey line shows CST = 3, which is the threshold for a cluster to be detected and included in HR23. Only clusters with a CST below 38 are shown; values larger than 38 are calculated as infinity by our Python method due to floating point precision.
Current usage metrics show cumulative count of Article Views (full-text article views including HTML views, PDF and ePub downloads, according to the available data) and Abstracts Views on Vision4Press platform.
Data correspond to usage on the plateform after 2015. The current usage metrics is available 48-96 hours after online publication and is updated daily on week days.
Initial download of the metrics may take a while.