Fig. 3
Download original image
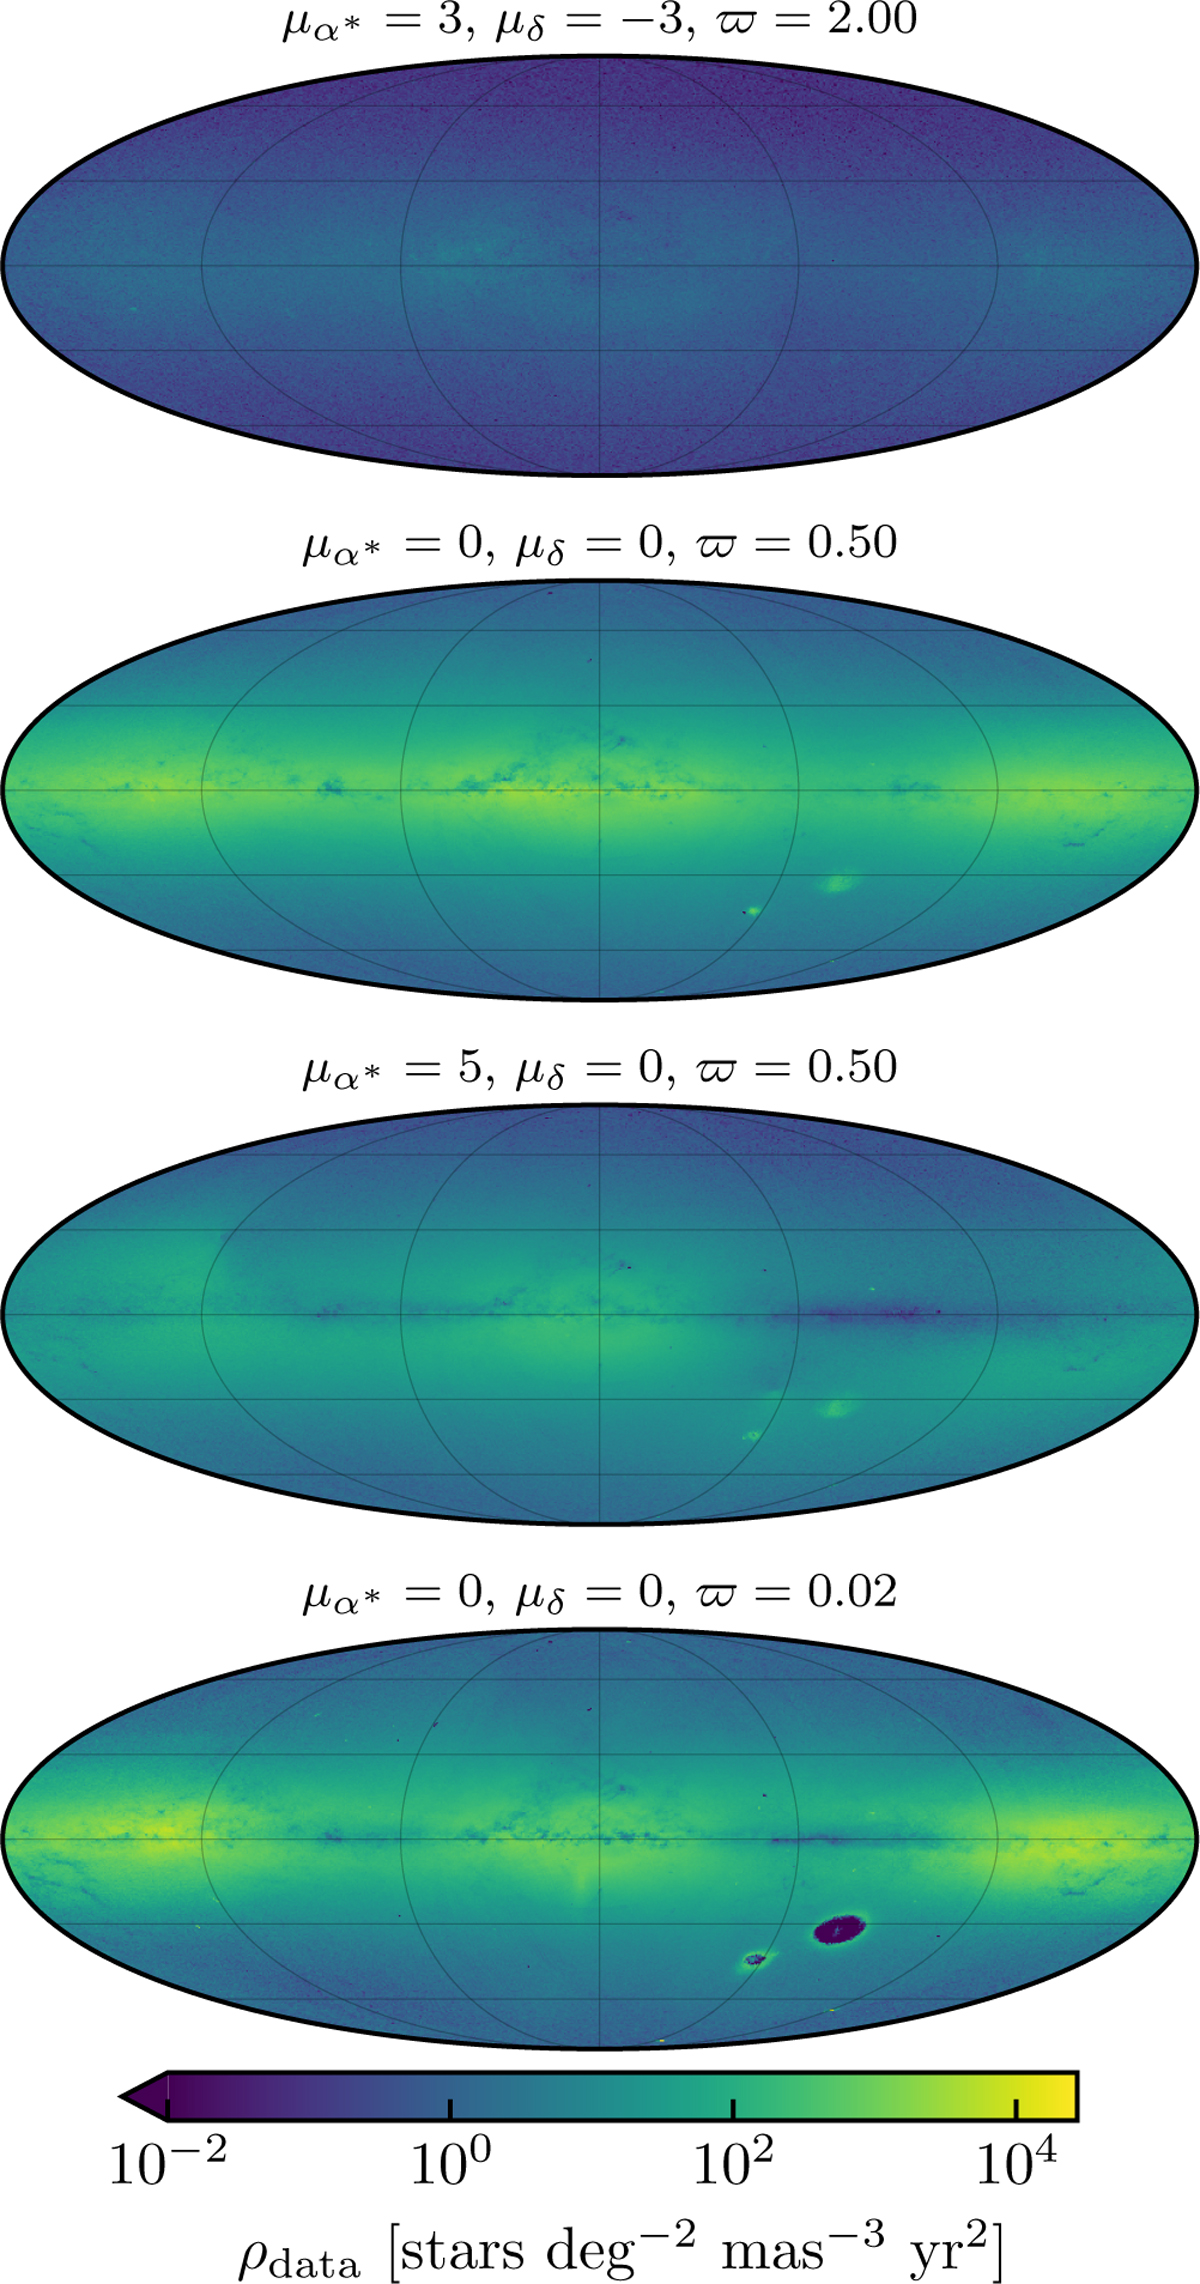
Four maps of Gaia data density at various proper-motion and parallax levels. The proper-motion and parallax values of each sub-plot are indicated in the titles, with proper motions given in milliarcseconds per year and parallax in milliarcseconds. Maps are plotted in a Mollweide projection in Galactic coordinates, with l increasing to the left, north being up, and the Galactic centre in the middle. Vertical and horizontal grid lines show spacings of 60 and 30 degrees in l and b, respectively.
Current usage metrics show cumulative count of Article Views (full-text article views including HTML views, PDF and ePub downloads, according to the available data) and Abstracts Views on Vision4Press platform.
Data correspond to usage on the plateform after 2015. The current usage metrics is available 48-96 hours after online publication and is updated daily on week days.
Initial download of the metrics may take a while.