Open Access
Fig. 6
Download original image
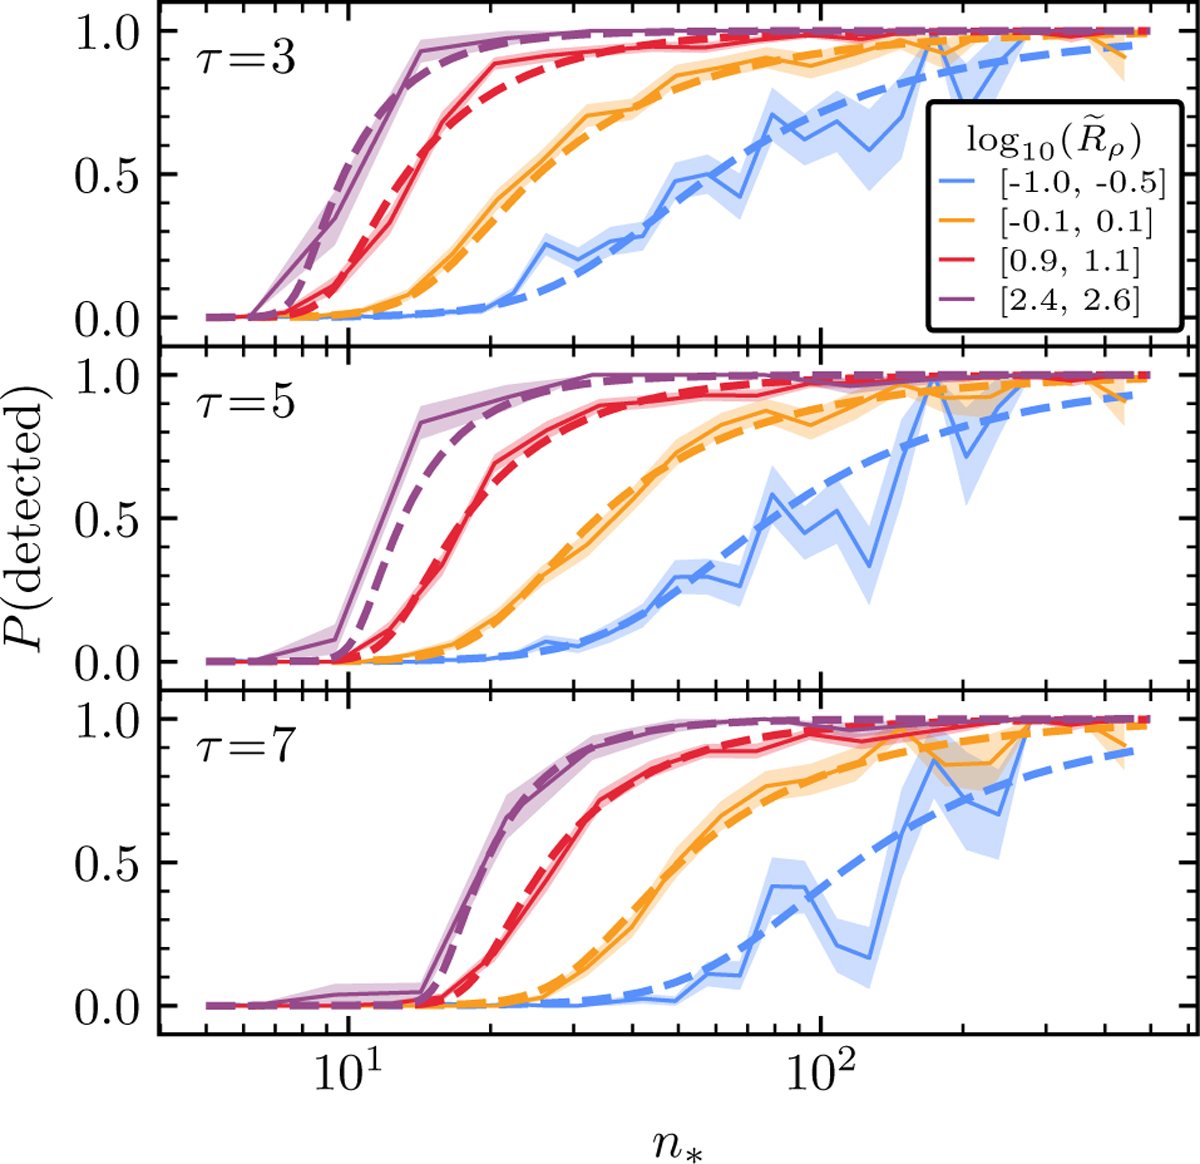
Comparison between injection and retrieval data (solid line, shaded region shows uncertainty) and our model (dashed line) for various CST thresholds, τ, and restricted to different density ranges, as indicated in the figure legend. Plots from top to bottom show τ levels of 3, 5, and 7, respectively.
Current usage metrics show cumulative count of Article Views (full-text article views including HTML views, PDF and ePub downloads, according to the available data) and Abstracts Views on Vision4Press platform.
Data correspond to usage on the plateform after 2015. The current usage metrics is available 48-96 hours after online publication and is updated daily on week days.
Initial download of the metrics may take a while.