Fig. 9
Download original image
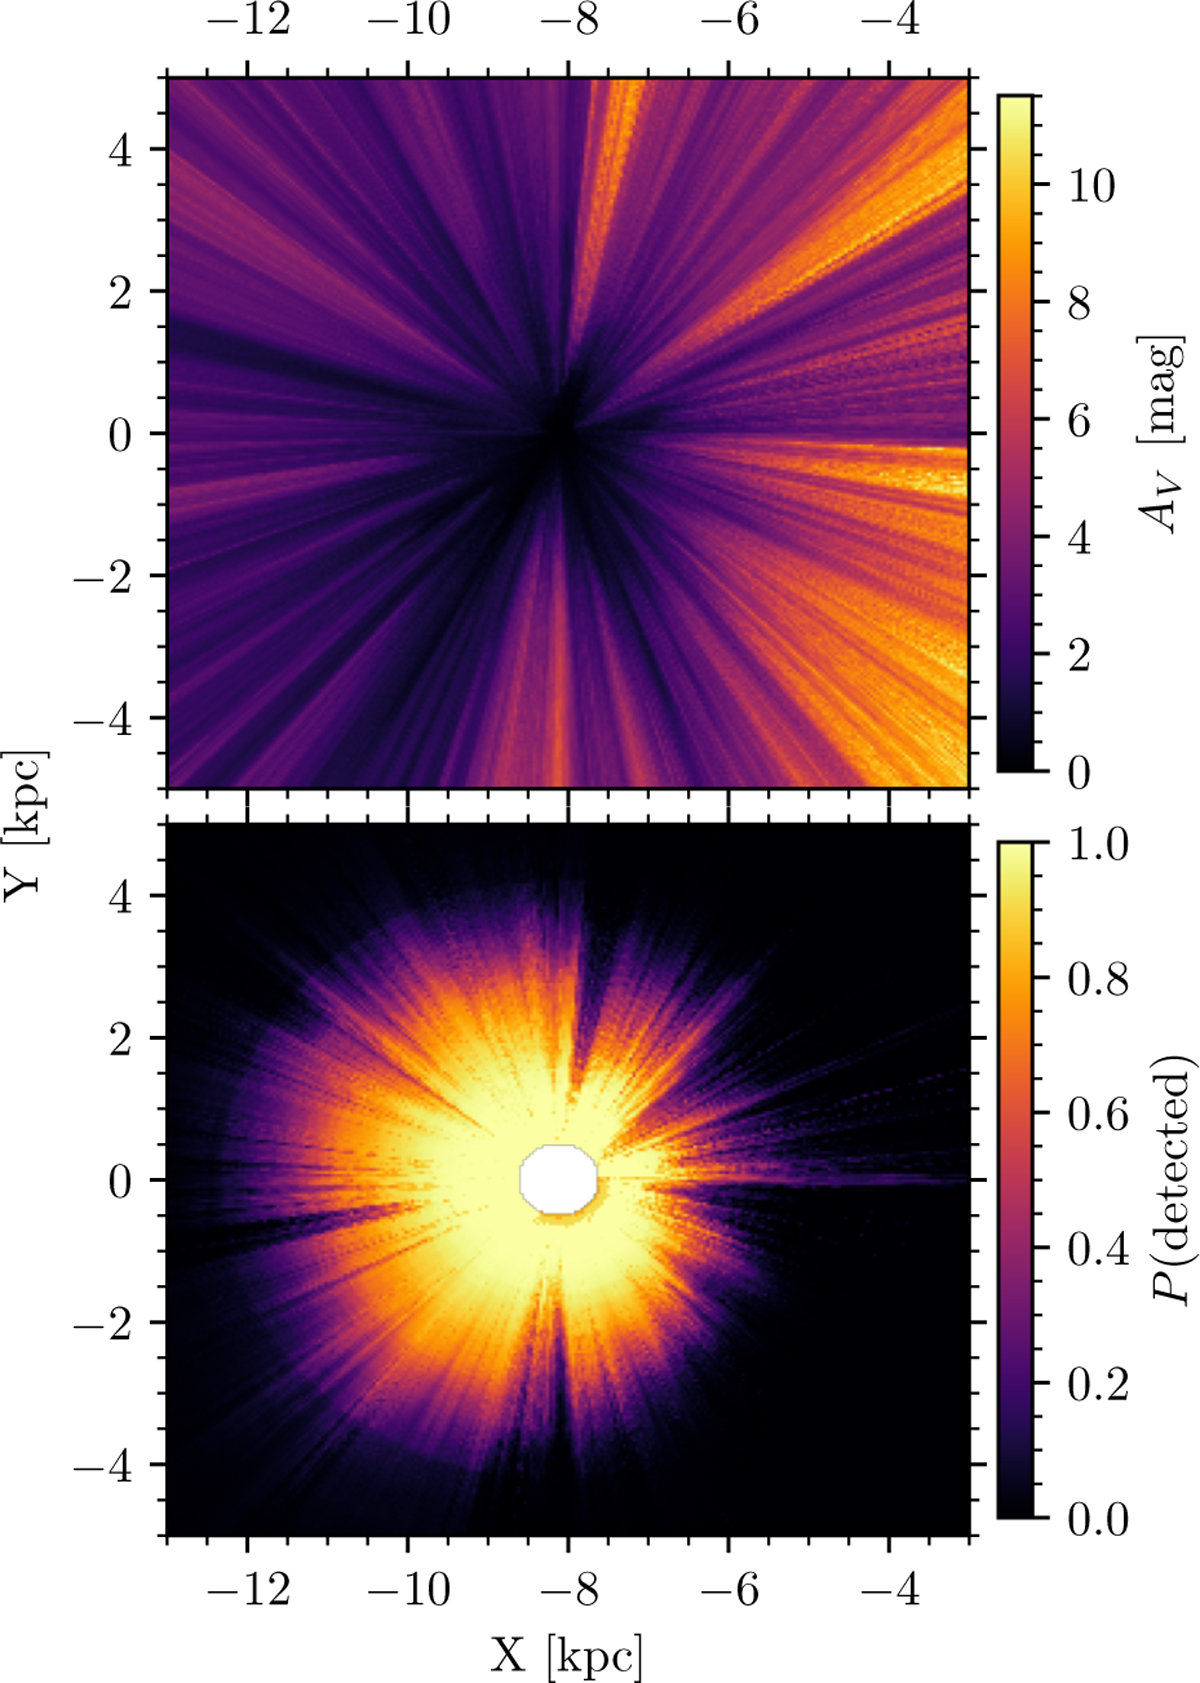
Example of application of our full selection function pipeline to map cluster detectability. Top: adopted dust map viewed top-down in galactocentric Cartesian coordinates with the Galactic centre to the right, averaged from z values from –100 to 100 pc. Bottom: as above, but predicting the detection probability of a 2.5 Gyr old, 200 M⊙ cluster with solar metallicity on a circular orbit. n∗ and med(σϖ) were predicted with our XGBoost predictor and then fed to our MCMC selection-function model. The white circle in the middle is a masked region, as distances lower than 500 pc were not considered in this study.
Current usage metrics show cumulative count of Article Views (full-text article views including HTML views, PDF and ePub downloads, according to the available data) and Abstracts Views on Vision4Press platform.
Data correspond to usage on the plateform after 2015. The current usage metrics is available 48-96 hours after online publication and is updated daily on week days.
Initial download of the metrics may take a while.