Open Access
Fig. 1
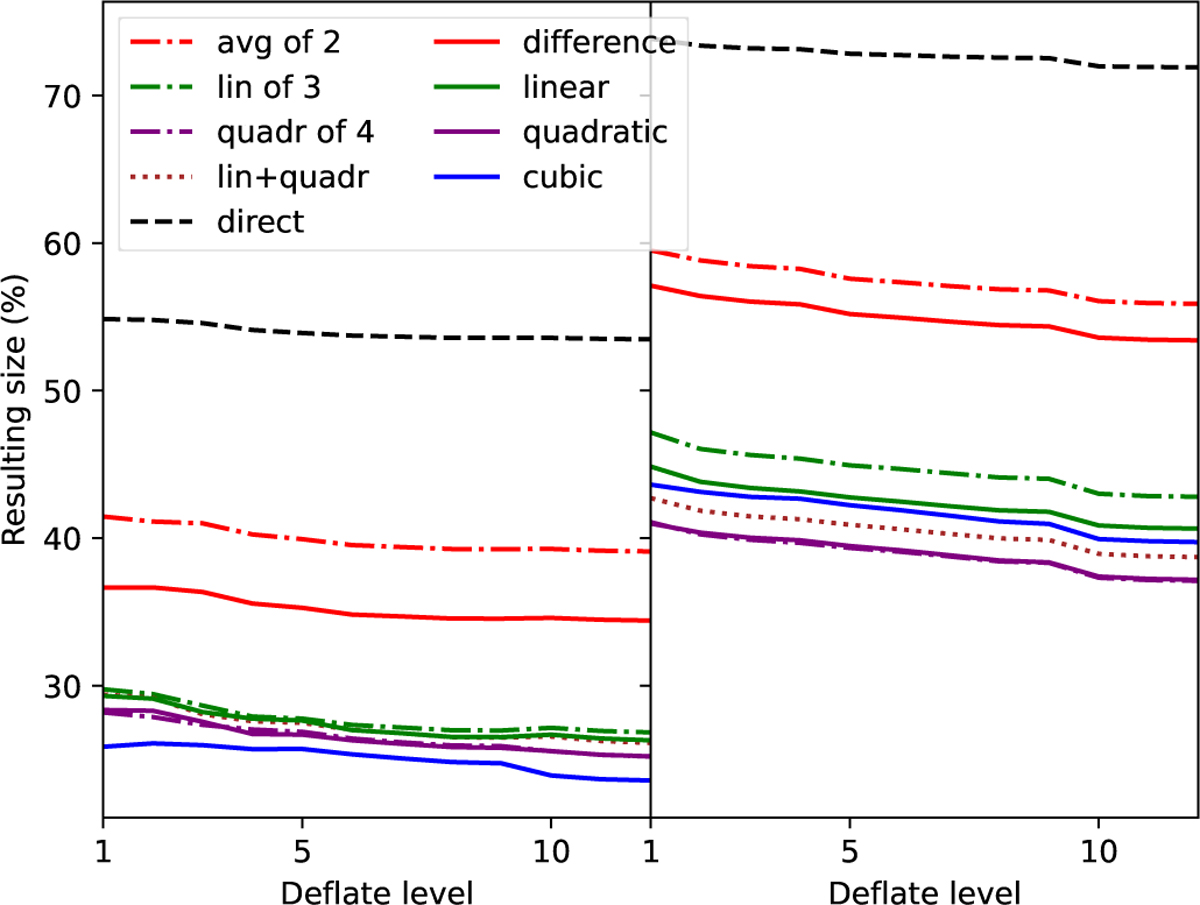
Download original image
Left panel: compression results when using a two-dimensional sine wave as input. Right panel: compression result for noiseless forward-predicted MWA data. Both plots show the compression results for various prediction schemes and as a function of the DEFLATE level.
Current usage metrics show cumulative count of Article Views (full-text article views including HTML views, PDF and ePub downloads, according to the available data) and Abstracts Views on Vision4Press platform.
Data correspond to usage on the plateform after 2015. The current usage metrics is available 48-96 hours after online publication and is updated daily on week days.
Initial download of the metrics may take a while.