Open Access
Fig. 9
Download original image
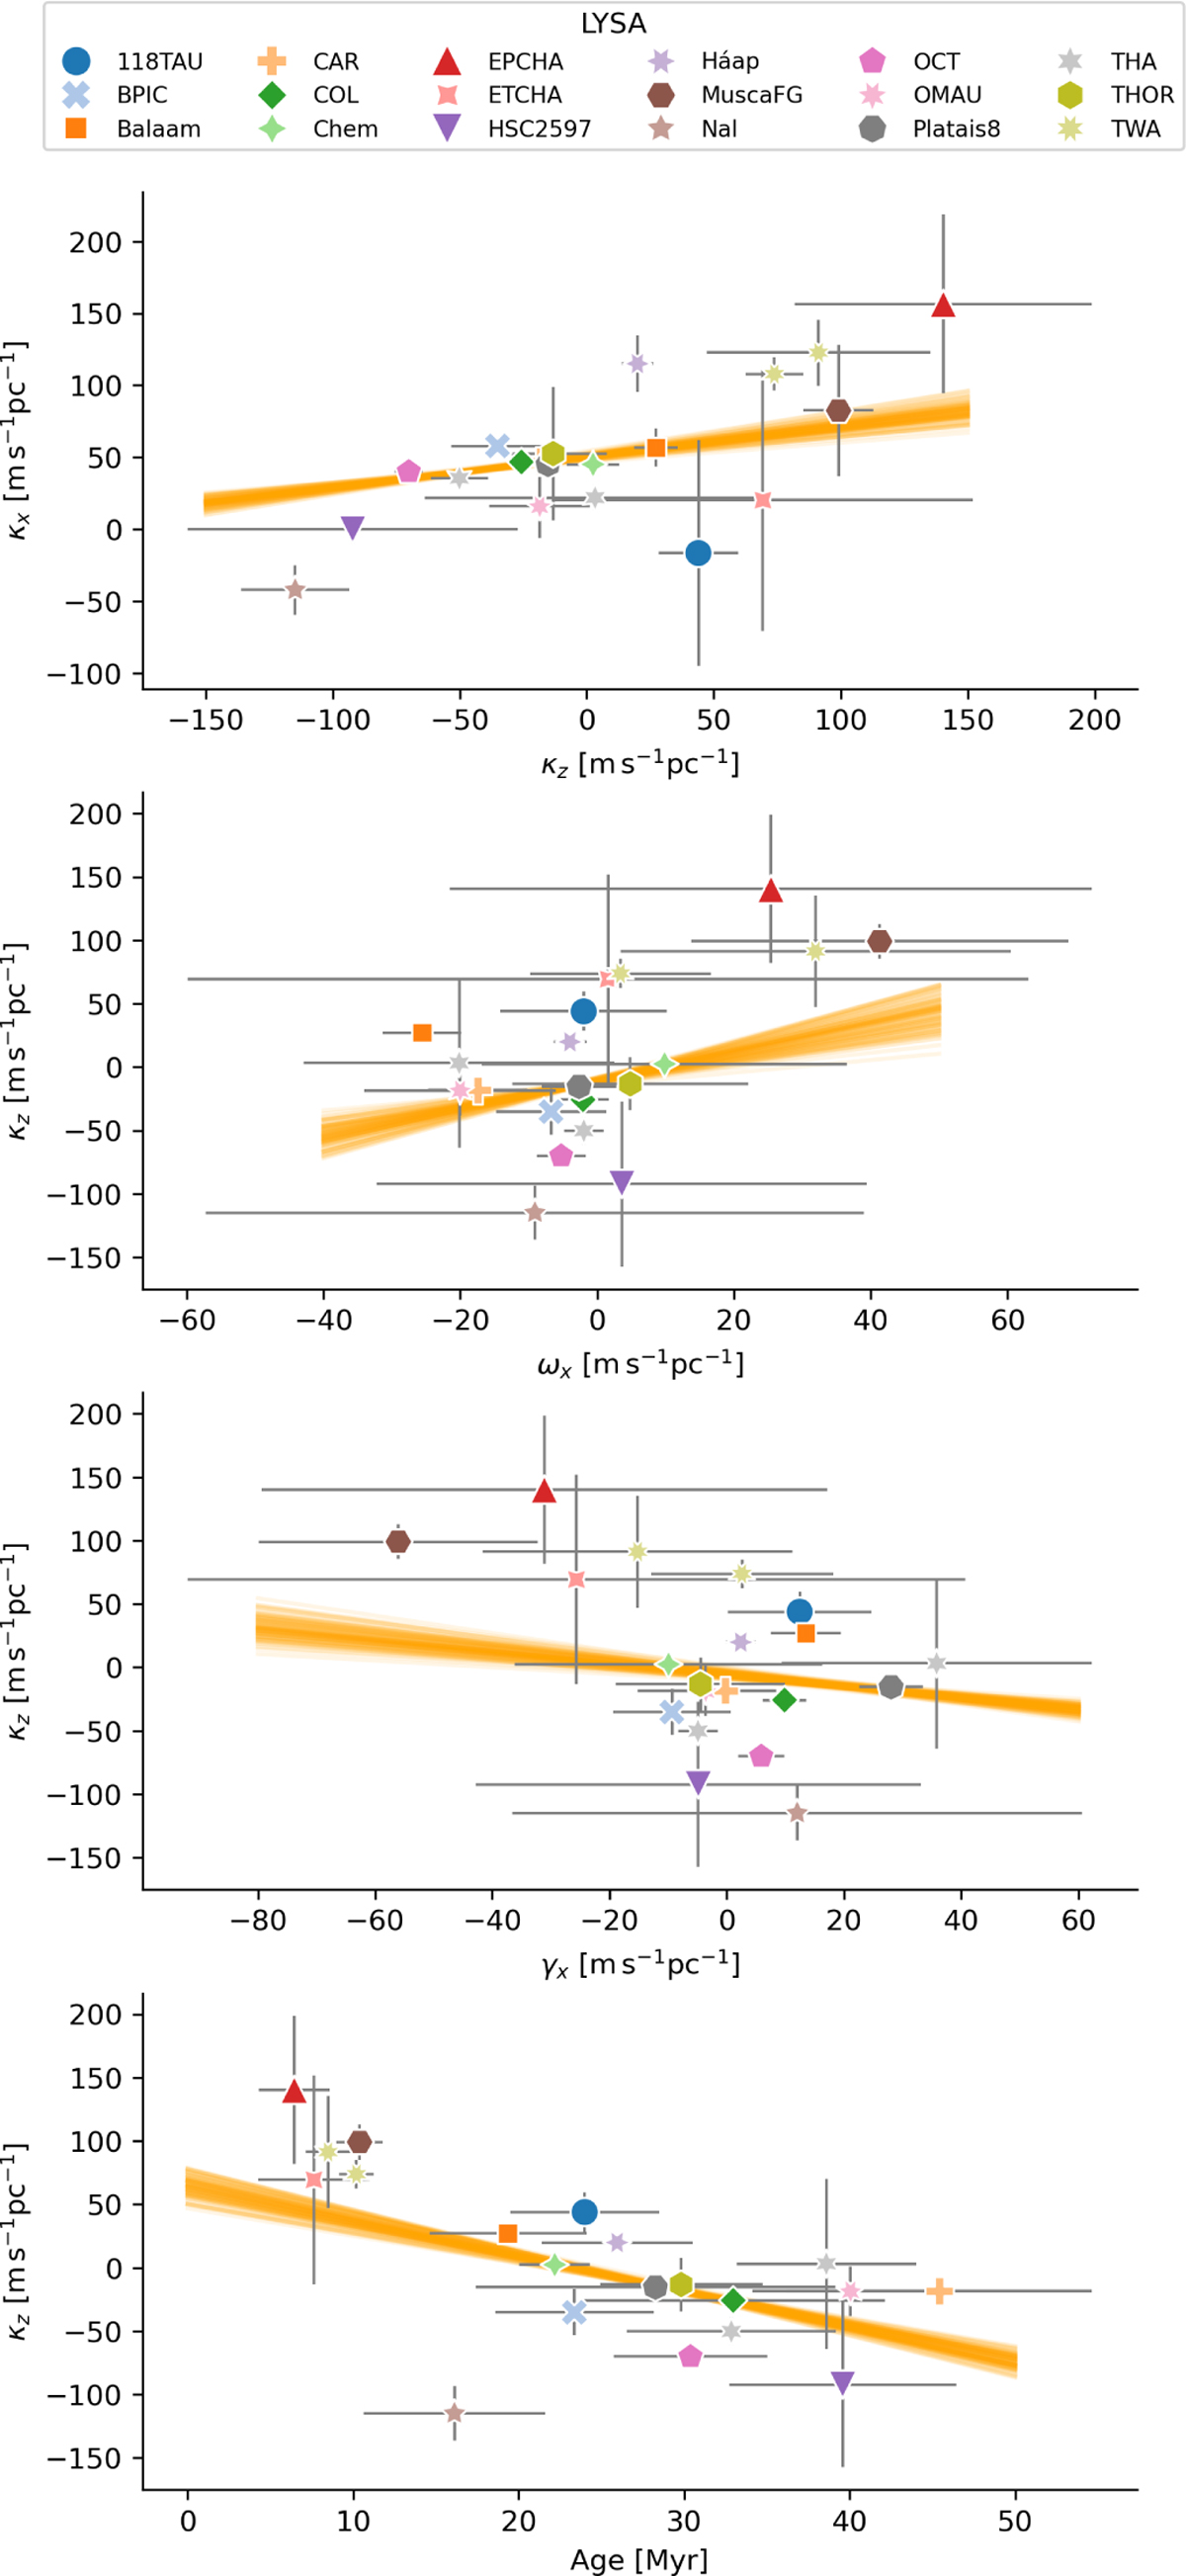
Summary of the identified robust correlations. The symbols and grey bars depict the mean and standard deviations of the parameter values of LYSAs inferred by Olivares et al. (2025b), while the orange lines show samples of the posterior distribution of the linear fit (degree-one polynomial) inferred in this work.
Current usage metrics show cumulative count of Article Views (full-text article views including HTML views, PDF and ePub downloads, according to the available data) and Abstracts Views on Vision4Press platform.
Data correspond to usage on the plateform after 2015. The current usage metrics is available 48-96 hours after online publication and is updated daily on week days.
Initial download of the metrics may take a while.