Open Access
Fig. 1
Download original image
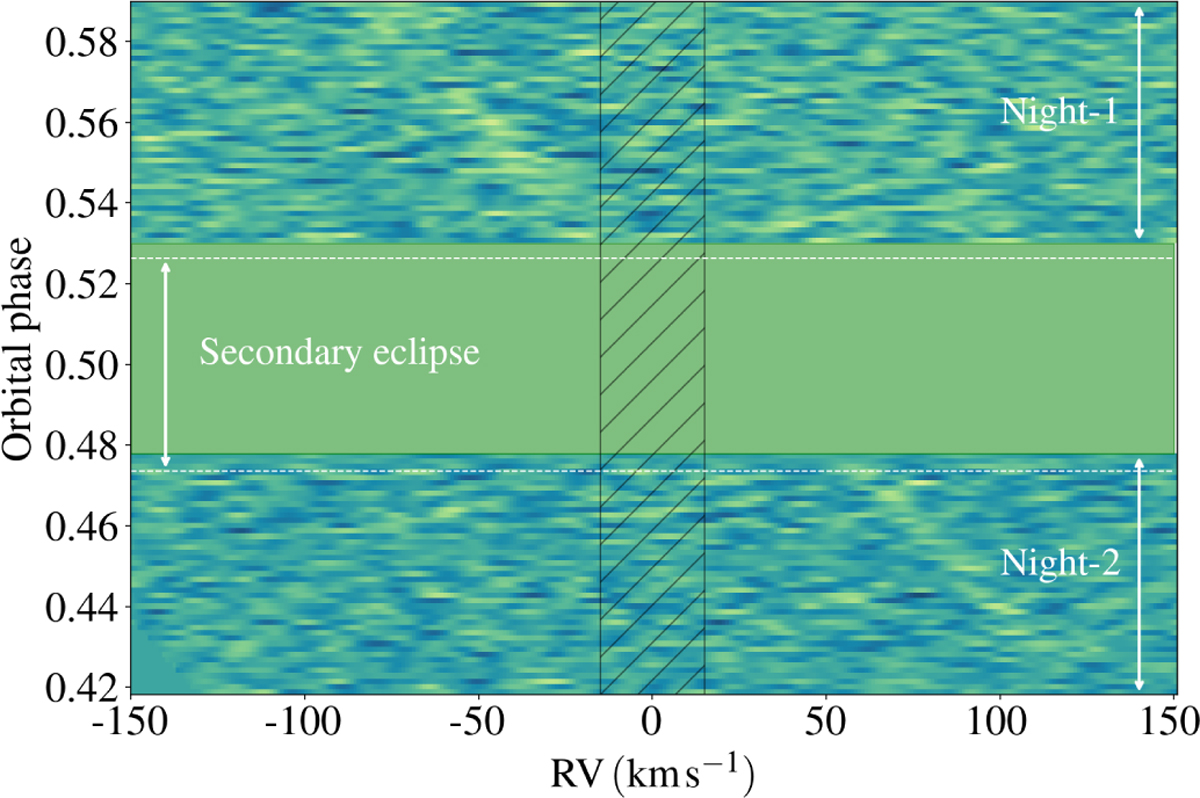
CCF for Fe I in the observer’s rest frame, obtained from PEPSI observations. Horizontal dashed lines indicate the temporal boundaries of the secondary eclipse. The hatched region highlights the moonlight-contaminated zone, which was systematically masked during the construction of the Kp – Δ v map.
Current usage metrics show cumulative count of Article Views (full-text article views including HTML views, PDF and ePub downloads, according to the available data) and Abstracts Views on Vision4Press platform.
Data correspond to usage on the plateform after 2015. The current usage metrics is available 48-96 hours after online publication and is updated daily on week days.
Initial download of the metrics may take a while.