Fig. 2
Download original image
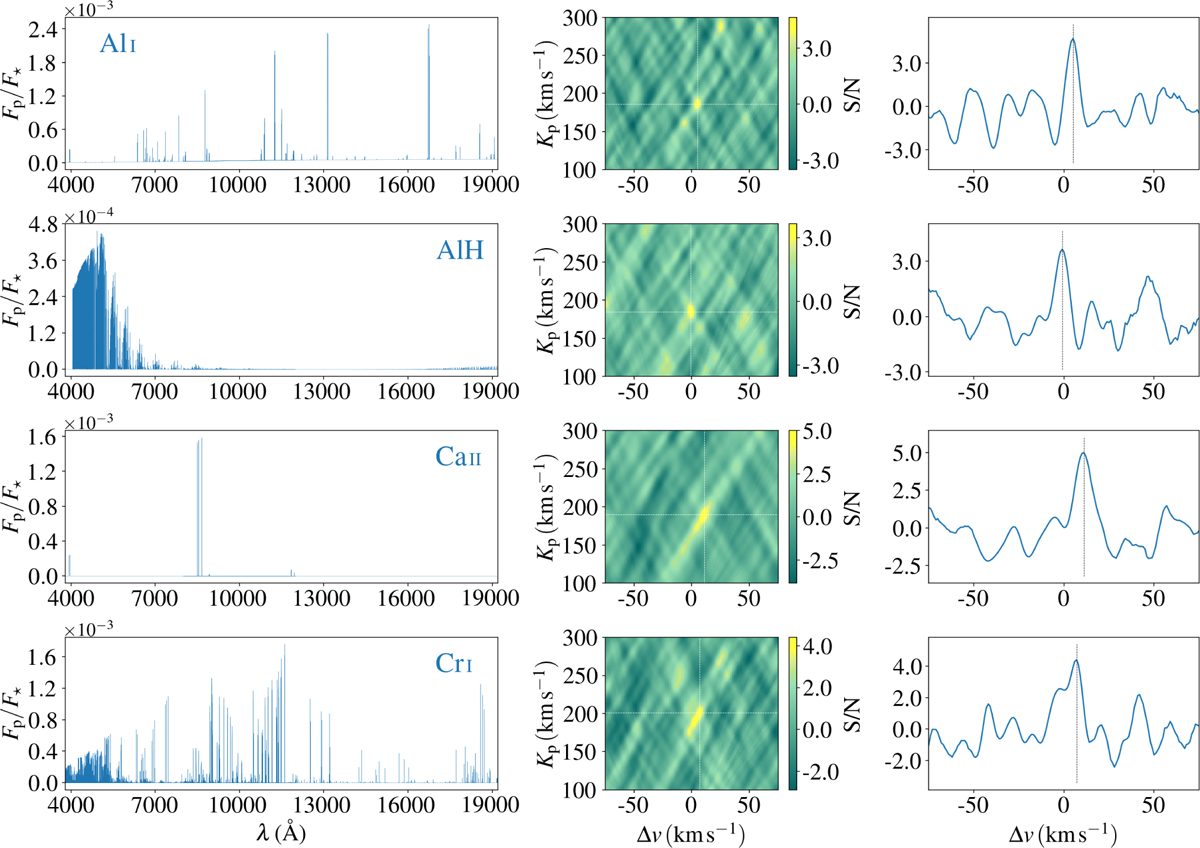
Model spectra and S/N maps for Al I, AlH, Ca II, and Cr I. Left panels: model spectra for each chemical species. Middle panels: corresponding S/N maps, combining data from both CARMENES and PEPSI instruments. The white dotted lines indicate the position of Kp – Δ v where the S/N reaches its maximum. Right panels: CCFs at the Kp values corresponding to the maximum S/N detections.
Current usage metrics show cumulative count of Article Views (full-text article views including HTML views, PDF and ePub downloads, according to the available data) and Abstracts Views on Vision4Press platform.
Data correspond to usage on the plateform after 2015. The current usage metrics is available 48-96 hours after online publication and is updated daily on week days.
Initial download of the metrics may take a while.