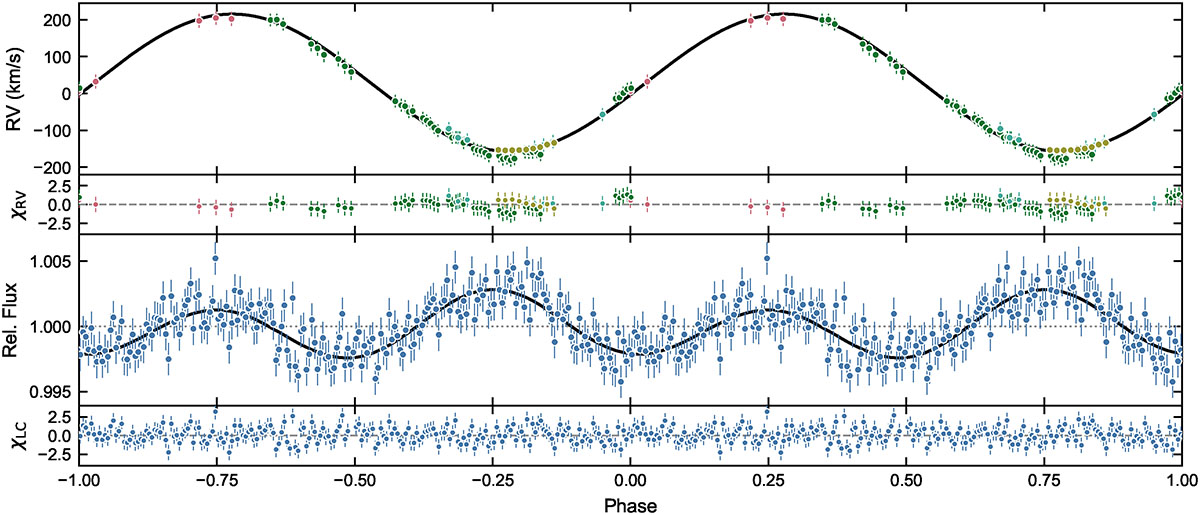
Fig. 1.
Download original image
Phased RV curve and phased and binned TESS light curve for J0658. Both curves are phased to the same period, P, and zero point, t0 (see Table B.1). For the RV curve, the plots show individual RV measurements from the LAMOST survey (salmon), the SOAR Goodman spectrograph (green; Clemens et al. 2004), the ALFOSC spectrograph (light blue), and the UVES spectrograph (ocher). The light curve shows 118287 TESS data points from TESS sectors 33 and 87 that were phased and then binned into 175 bins. Both curves show their respective best-fitting models. For the RV curve, the fit was obtained via the MCMC method, and for the TESS light curve it was obtained using the LCURVE code.
Current usage metrics show cumulative count of Article Views (full-text article views including HTML views, PDF and ePub downloads, according to the available data) and Abstracts Views on Vision4Press platform.
Data correspond to usage on the plateform after 2015. The current usage metrics is available 48-96 hours after online publication and is updated daily on week days.
Initial download of the metrics may take a while.