Open Access
Fig. D.1.
Download original image
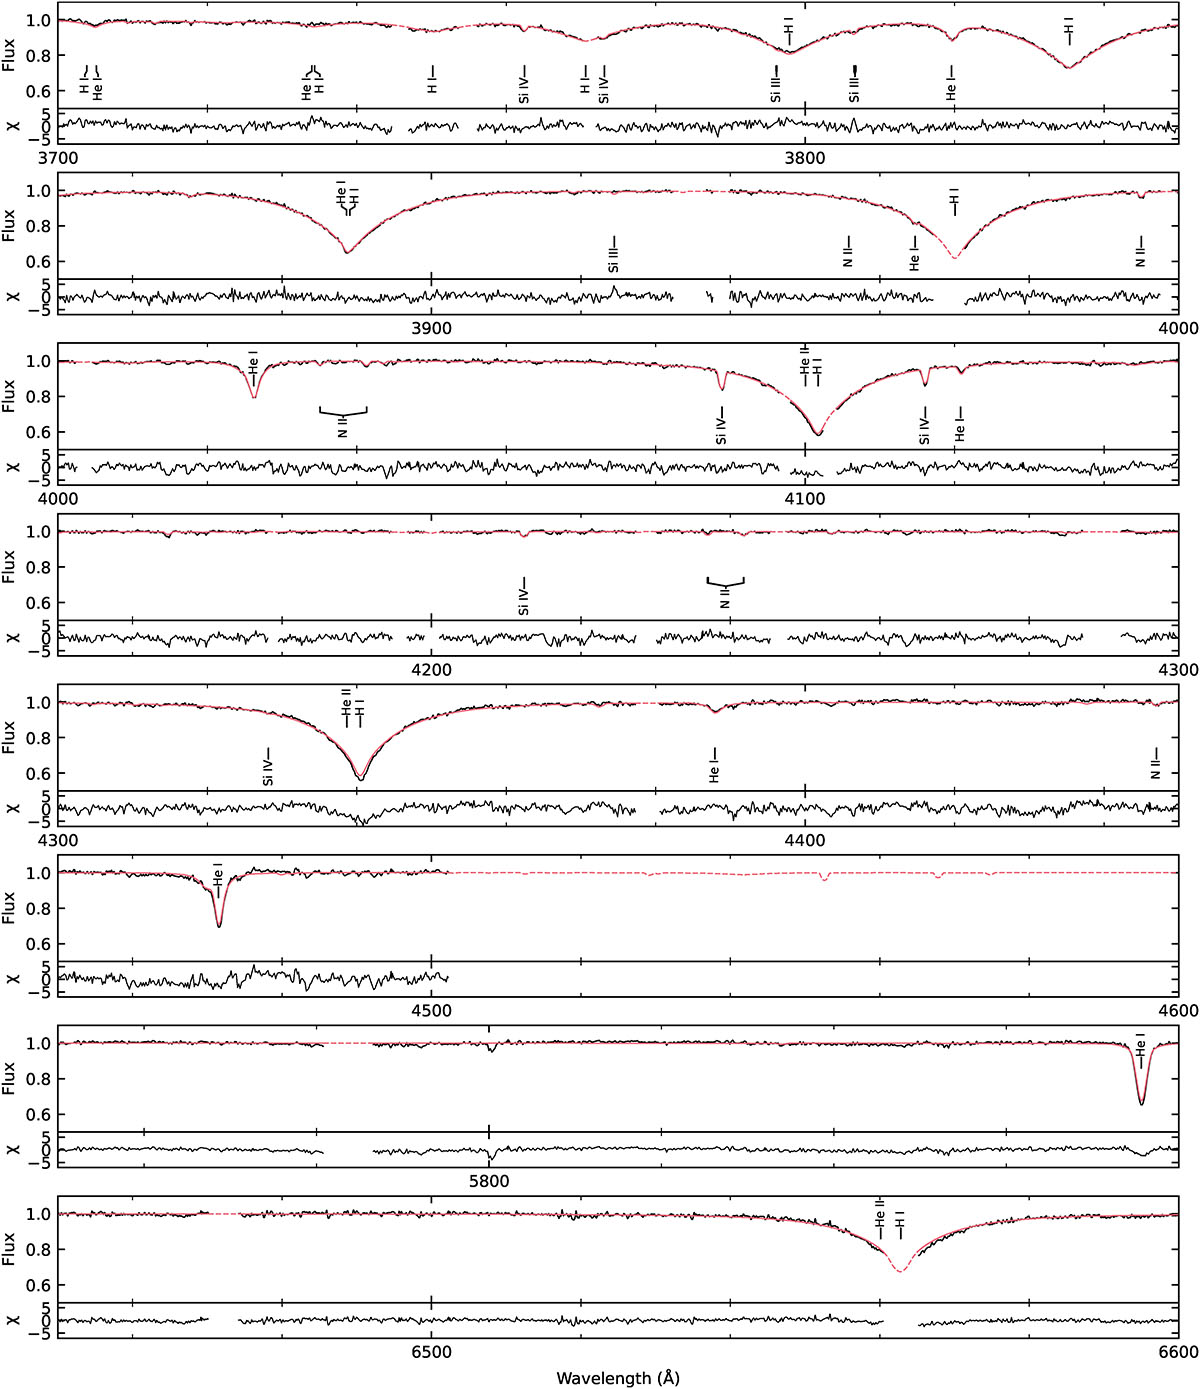
Stacked and re-binned (50000 bins) UVES spectra for J0658. The black line represents the spectral data, the red line the best-fitting model spectrum. The gap between the end of the UVES blue arm and red arm (4500Å − 5700Å) and sections of the spectrum without any absorption lines are not shown.
Current usage metrics show cumulative count of Article Views (full-text article views including HTML views, PDF and ePub downloads, according to the available data) and Abstracts Views on Vision4Press platform.
Data correspond to usage on the plateform after 2015. The current usage metrics is available 48-96 hours after online publication and is updated daily on week days.
Initial download of the metrics may take a while.