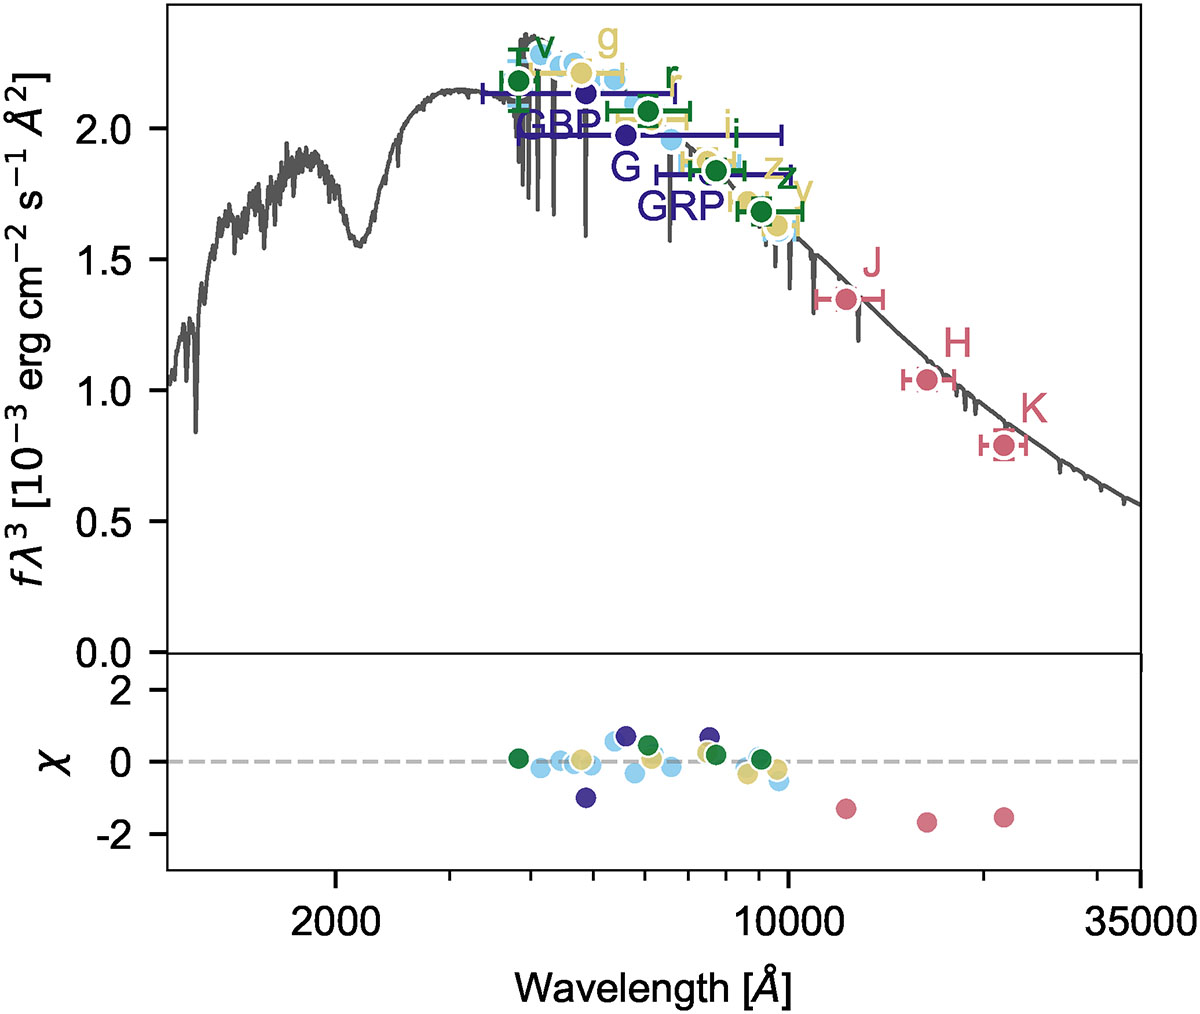
Fig. D.2.
Download original image
Spectral energy distribution of J0658. Valid fluxes from all available photometric surveys are shown. The best-fitting synthetic spectral model is overlaid as a gray line. Horizontal error bars represent the filter width at tenth maximum. (Data publications: Pan-STARRS1 (yellow): Chambers et al. 2016; 2MASS (salmon): Cutri et al. 2003; SkyMapper (green): Onken et al. 2019; and Gaia G/BP/RP (blue) and Gaia XP (light blue): Gaia Collaboration 2022).
Current usage metrics show cumulative count of Article Views (full-text article views including HTML views, PDF and ePub downloads, according to the available data) and Abstracts Views on Vision4Press platform.
Data correspond to usage on the plateform after 2015. The current usage metrics is available 48-96 hours after online publication and is updated daily on week days.
Initial download of the metrics may take a while.