Fig. A.1
Download original image
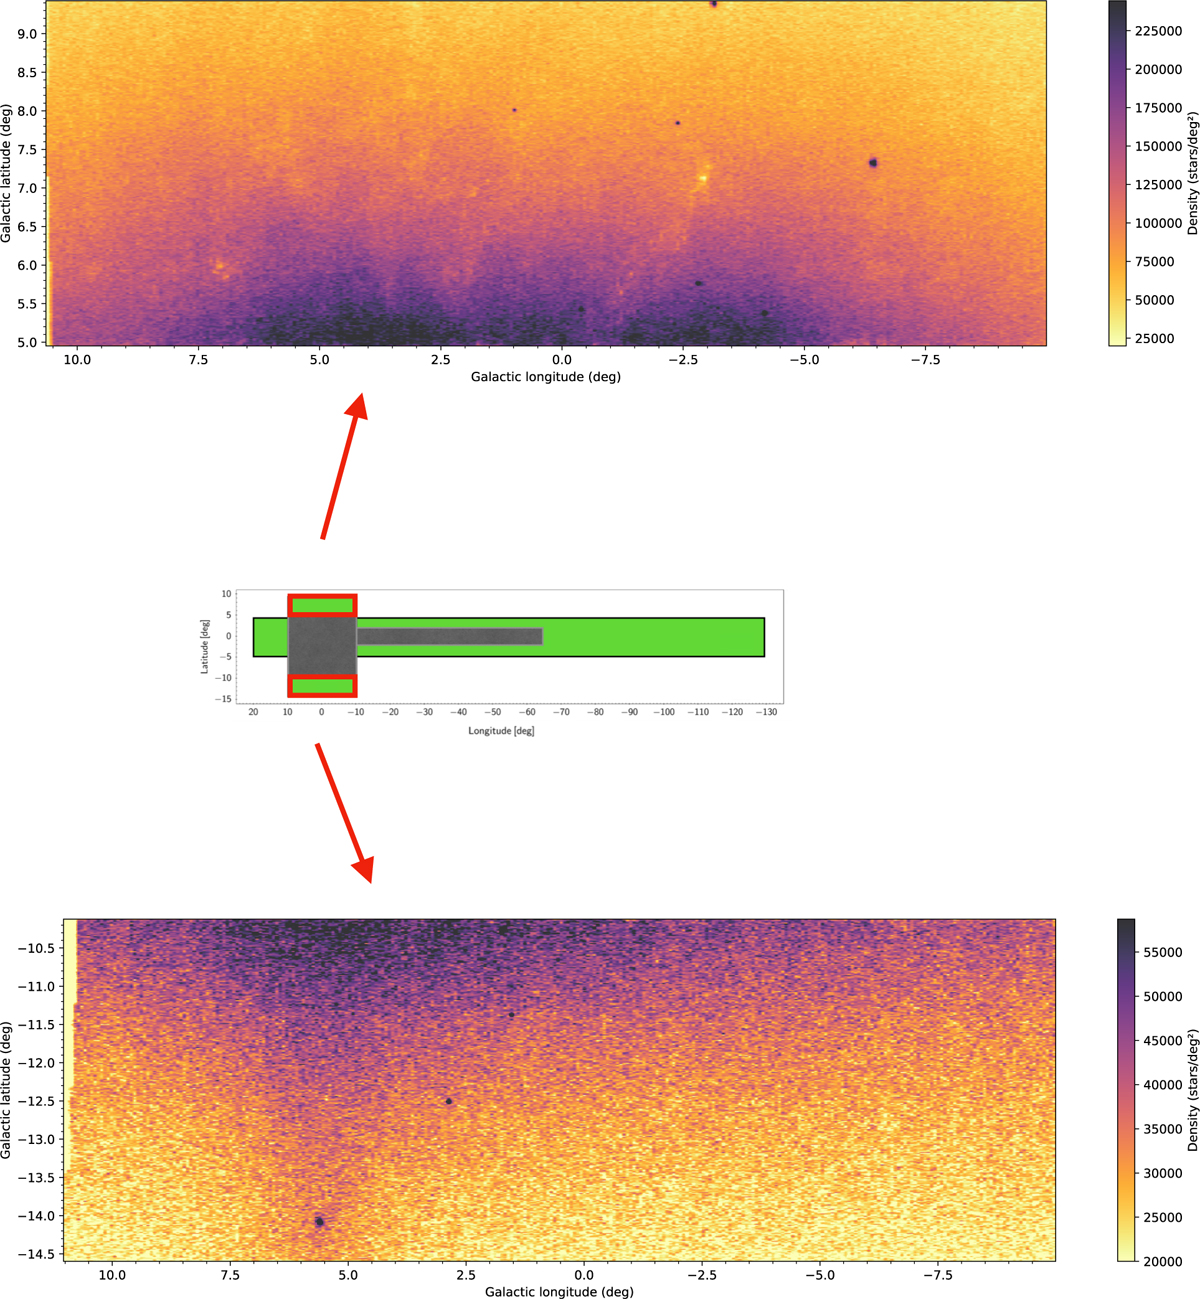
Point-source density maps of the VVVX surveyed regions in the outer bulge, showing sources detected down to Ks=16.0. Higher densities are shown with cooler colors, as indicated by the color bars on the right. Density increases toward the Galactic plane; note the different color bar ranges for the two panels. Darker points mark highly crowded stellar clusters. In the lower panel, the Sagittarius stream appears as a region of enhanced density near Galactic longitude l ∼ 5°.5.
Current usage metrics show cumulative count of Article Views (full-text article views including HTML views, PDF and ePub downloads, according to the available data) and Abstracts Views on Vision4Press platform.
Data correspond to usage on the plateform after 2015. The current usage metrics is available 48-96 hours after online publication and is updated daily on week days.
Initial download of the metrics may take a while.