Fig. 1
Download original image
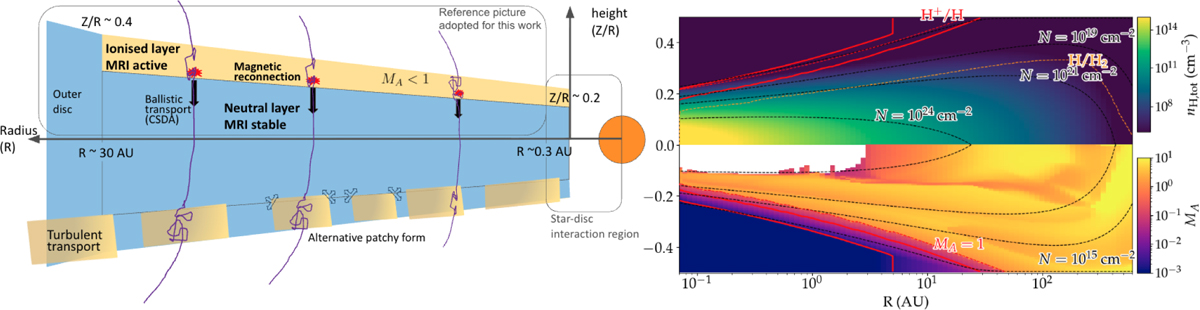
Left: schematic radial cut from R ~ 0.1 to ~50 AU presenting our scenario qualitatively. The disc is vertically stratified into a neutral mid-plane (blue; MRI-stable), where EPs arriving from above travel quasi-ballistically (CSDA-like) along near-vertical paths, and an ionised atmosphere (yellow; low-βp MRI-active), where sub-Alfvénic turbulence (MA < 1) triggers turbulent magnetic reconnection that injects EPs, which then stream downwards (black arrows). In the bottom left part, a patchy variant of the ionised atmospheric layer is sketched, with a lower covering area and possible lateral growth (black arrows). In the ionised turbulent layer, EP transport could be treated as stochastic. The inner star–disc interaction zone treated in Brunn et al. (2023, 2024) is indicated at R ≲ 0.3. Right: radial cut from R ~ 0.07 to ~600 AU displaying the disc chemical and turbulent structure used in this work based on the PRODIMO model. The top panel shows the total hydrogen number density, nH,tot (colour), with vertical column-density contours N = 1015, 1019, 1021, 1024 cm−2 (dashed black). The dashed red line marks the ionised–atomic transition (H+/H) defining the border between the region where H+ dominates and the region where H dominates. Analogously, the dashed orange line delimits the atomic–molecular transition (H/H2). The bottom panel displays the Alfvénic Mach number MA ≡ vturb/VA (colour). The red curve traces MA = 1. The sub-Alfvénic region (MA < 1) identifies where fast, turbulence-enabled reconnection, and thus EP acceleration, is expected. The solid red lines delimit the region where EP are efficiently accelerated, i.e. to energy more than 10 MeV. The white region is the so-called ‘dead zone’, where MRI is inefficient (see criterion Eq. (A.1)), there is no turbulence, MA is set to 0.
Current usage metrics show cumulative count of Article Views (full-text article views including HTML views, PDF and ePub downloads, according to the available data) and Abstracts Views on Vision4Press platform.
Data correspond to usage on the plateform after 2015. The current usage metrics is available 48-96 hours after online publication and is updated daily on week days.
Initial download of the metrics may take a while.