Fig. 10
Download original image
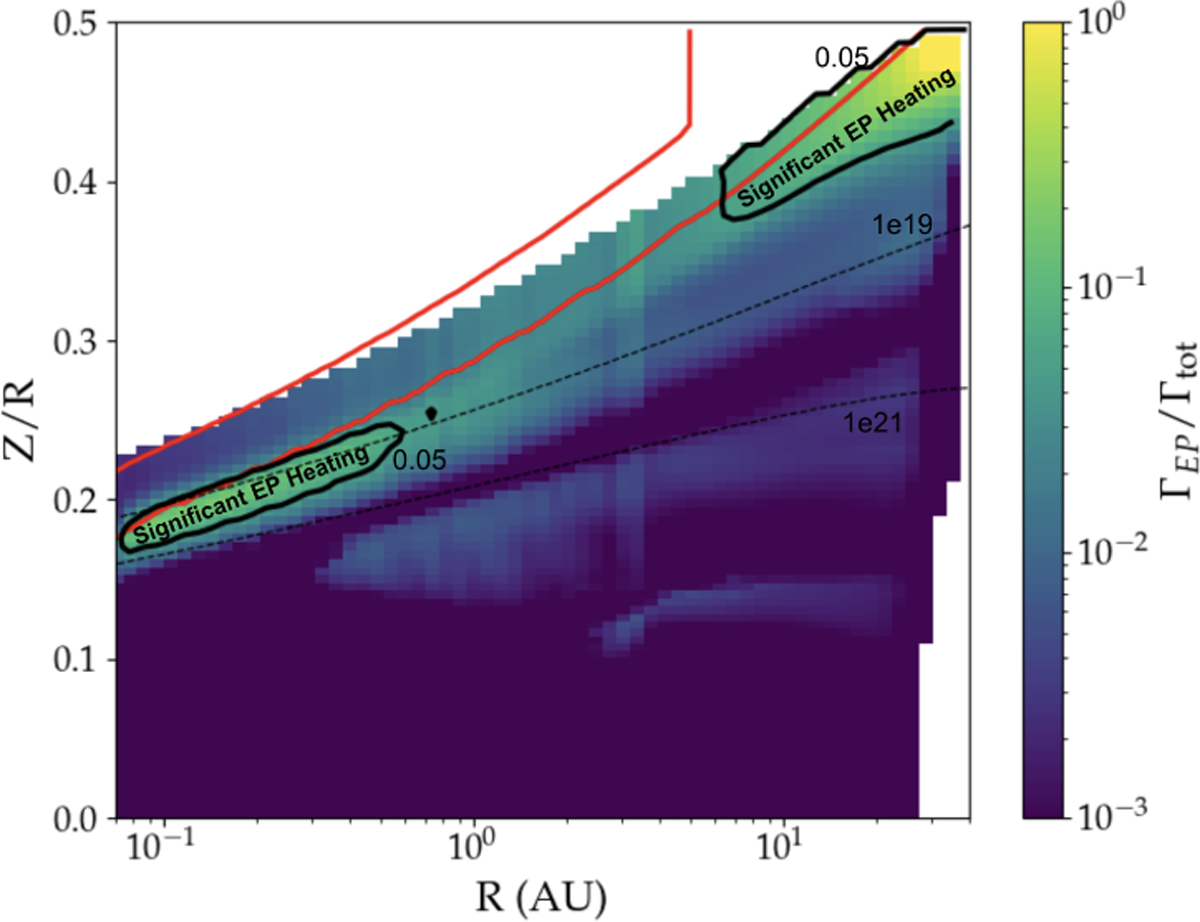
Relative EP heating map for κ = 1. Ratio ΓEP/Γtot as a function of radius R (AU) and height Z/R; colours show the fraction on a logarithmic scale from 10−3 to 1. The red contour encloses the zone where EPs are efficiently accelerated (Emax > 10 MeV). The solid black contour marks where EP heating contributes at least to 5% of the total heating (ΓEP/Γtot = 0.05), which is considered to be a significant contribution. The dashed lines delimit the disc surface between column densities of 1019–1021 cm−2.
Current usage metrics show cumulative count of Article Views (full-text article views including HTML views, PDF and ePub downloads, according to the available data) and Abstracts Views on Vision4Press platform.
Data correspond to usage on the plateform after 2015. The current usage metrics is available 48-96 hours after online publication and is updated daily on week days.
Initial download of the metrics may take a while.