Fig. 5
Download original image
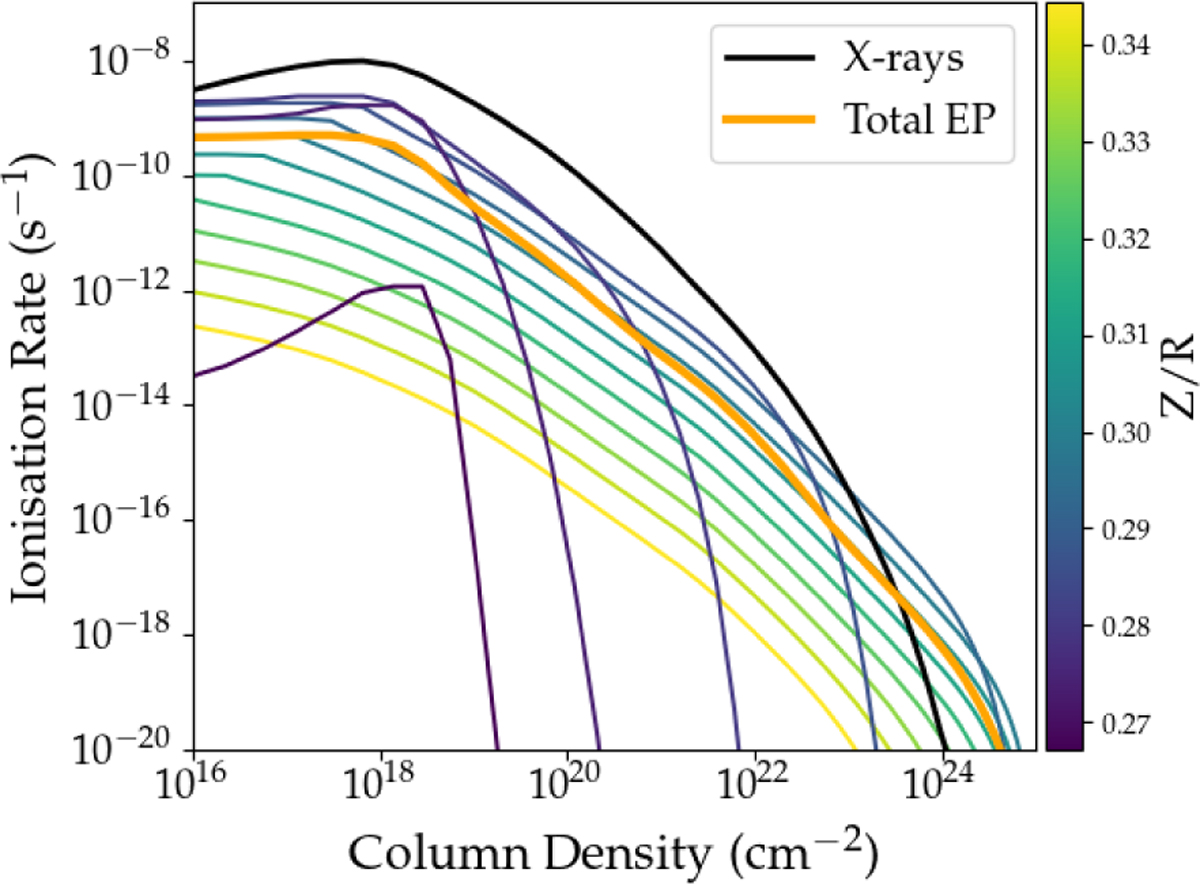
Ionisation rates as function of the disc vertical column density at R = 1 AU for κ = 0.1. The lines in the viridis colour scale are the contribution to the ionisation rate coming from EPs accelerated in region at different Z/R. The thick orange line is the total ionisation rate corresponding to the weighted sum (Eq. (21)) of each local contribution. The black line is the ionisation rate from the stellar X-rays.
Current usage metrics show cumulative count of Article Views (full-text article views including HTML views, PDF and ePub downloads, according to the available data) and Abstracts Views on Vision4Press platform.
Data correspond to usage on the plateform after 2015. The current usage metrics is available 48-96 hours after online publication and is updated daily on week days.
Initial download of the metrics may take a while.