Fig. 7
Download original image
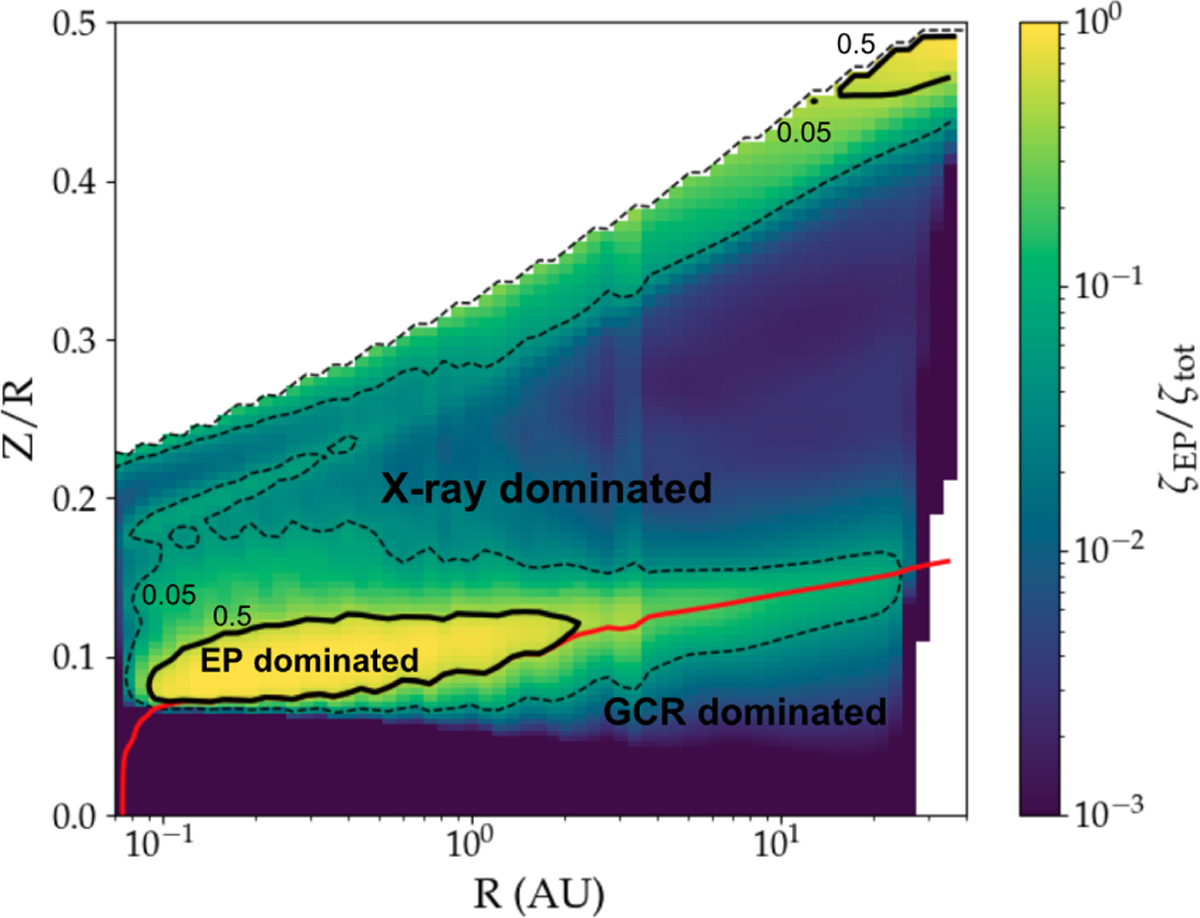
Ionisation rate due to EPs (ζEP) compared to the total ionisation rate ζtot = ζXR + ζGCR + ζEP, for the reference case κ = 0.1, where ζXR and ζGCR are the ionisation rates due to X-rays and GCRs, respectfully. The solid black contours mark regions where ionisation from EPs dominates over all other ionisation sources, while the dashed black line indicates where the EP ionisation is 5% of the total ionisation rate. The red contour outlines regions dominated by GCRs. The region in between is dominated by X-ray ionisation.
Current usage metrics show cumulative count of Article Views (full-text article views including HTML views, PDF and ePub downloads, according to the available data) and Abstracts Views on Vision4Press platform.
Data correspond to usage on the plateform after 2015. The current usage metrics is available 48-96 hours after online publication and is updated daily on week days.
Initial download of the metrics may take a while.