Open Access
Fig. 9
Download original image
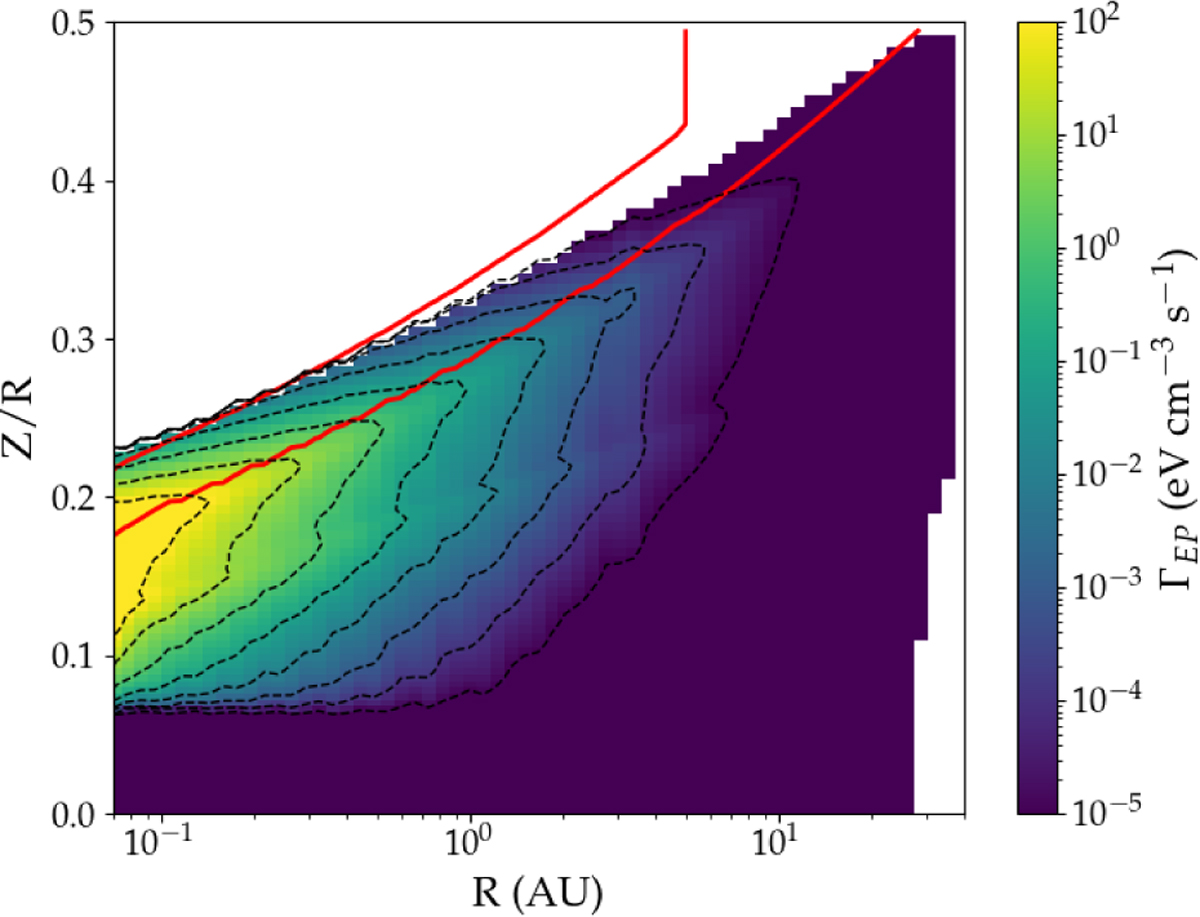
EP volumetric heating rate map for κ = 1. The solid red contour encloses the region where EPs are accelerated. Dashed curves are isocontours of the EP volumetric heating rate. The upper white band marks very low columns (N < 1015 cm−2), i.e. above the disc atmosphere.
Current usage metrics show cumulative count of Article Views (full-text article views including HTML views, PDF and ePub downloads, according to the available data) and Abstracts Views on Vision4Press platform.
Data correspond to usage on the plateform after 2015. The current usage metrics is available 48-96 hours after online publication and is updated daily on week days.
Initial download of the metrics may take a while.