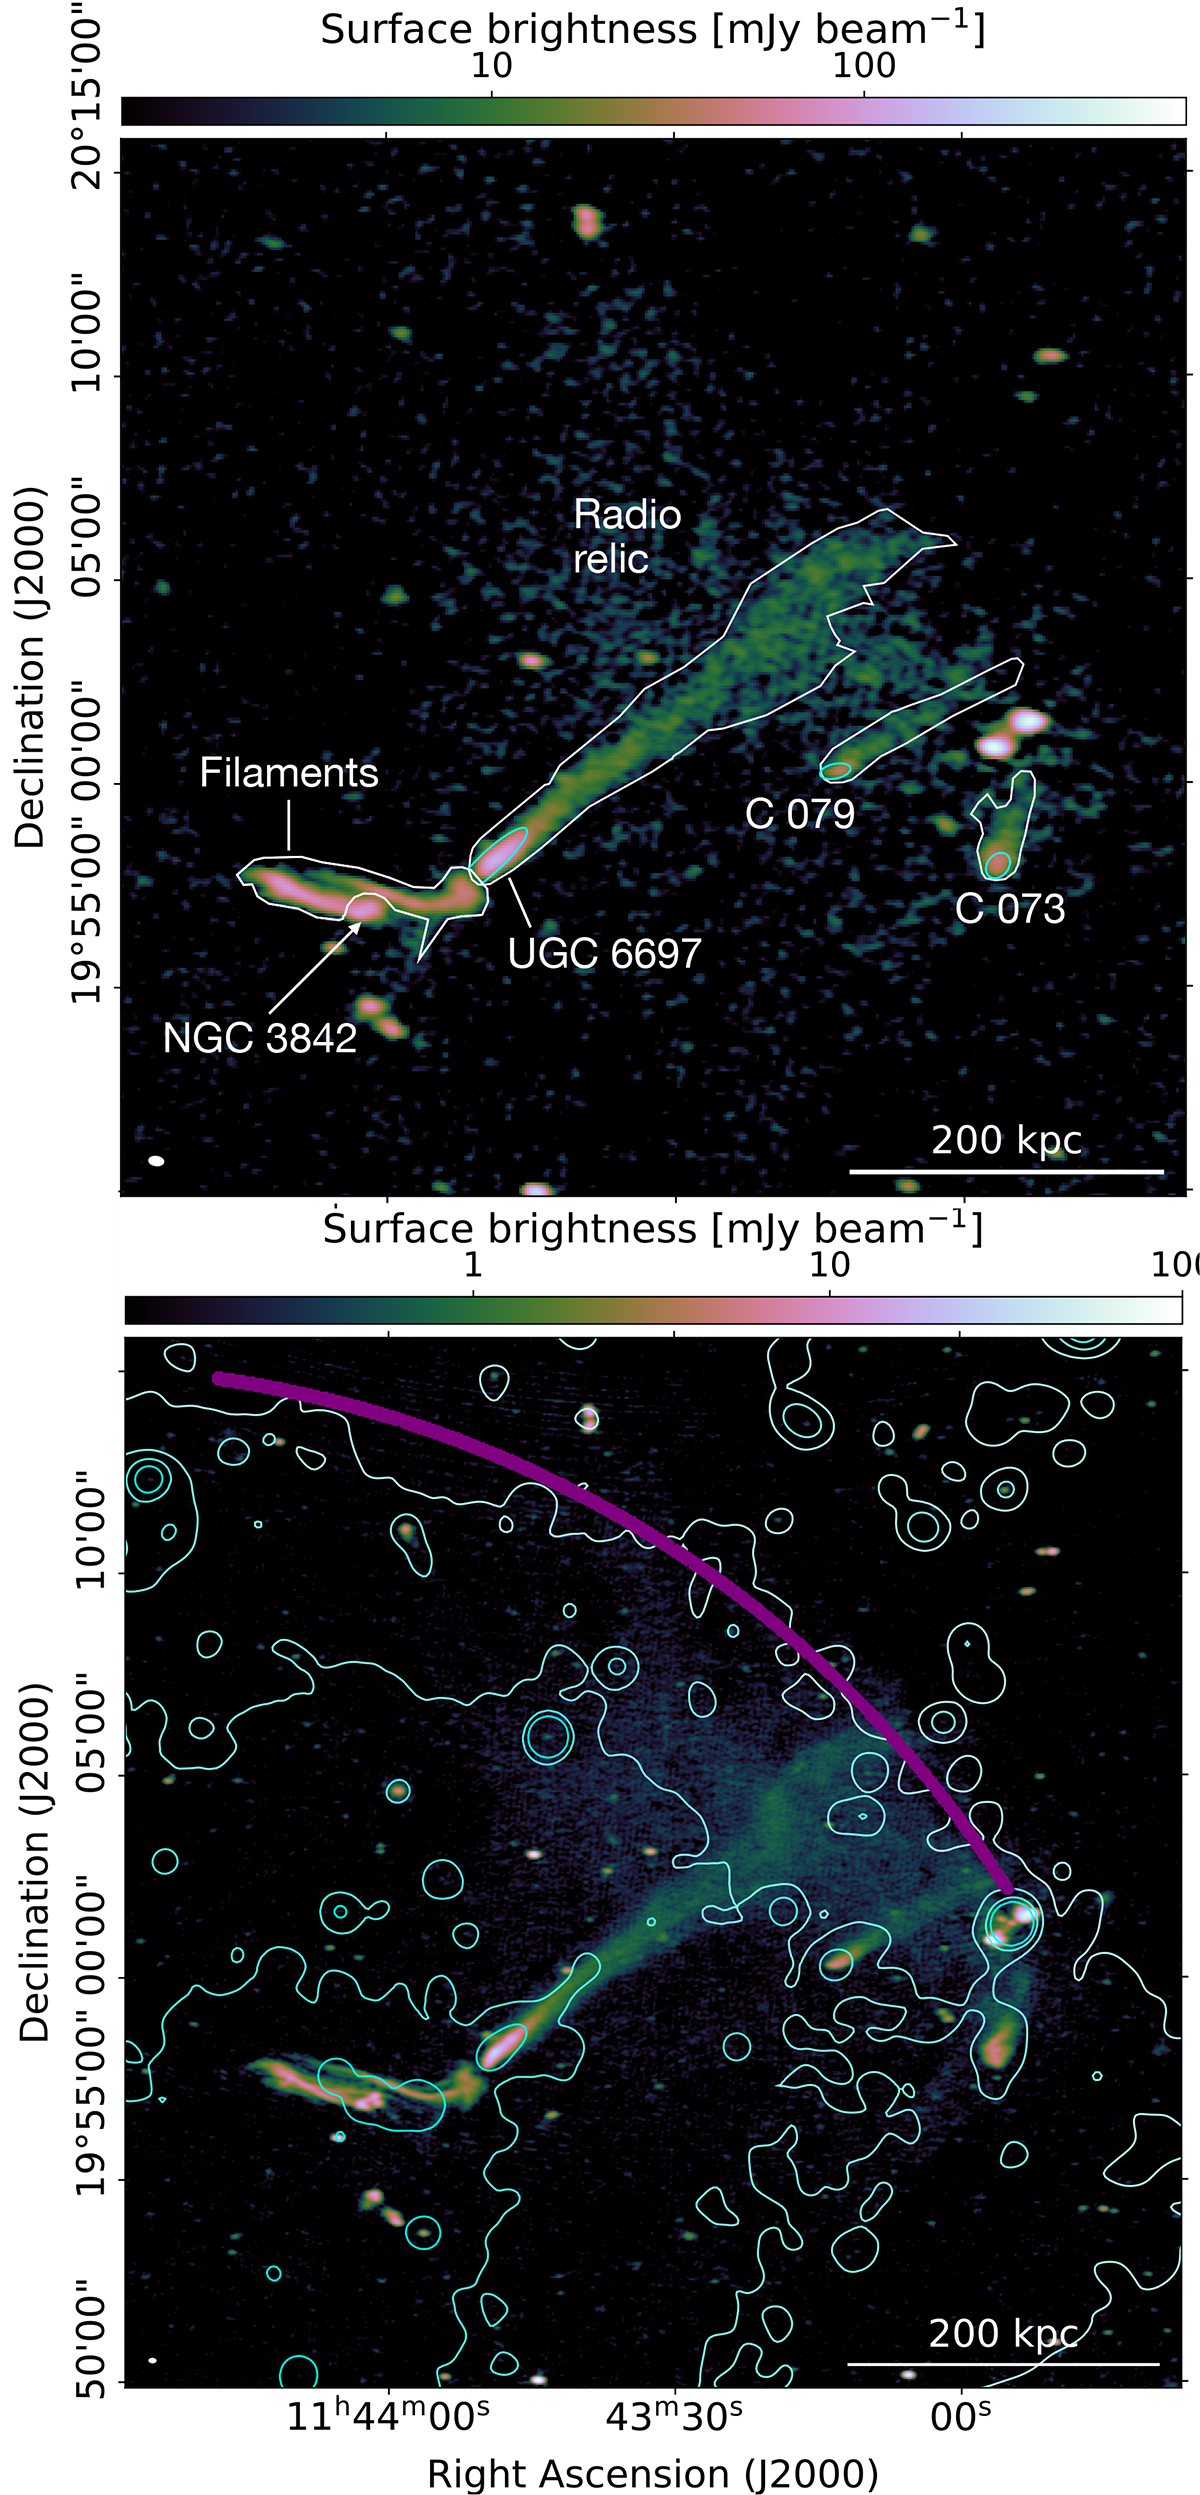
Fig. 1.
Download original image
Top panel: Northwest of A1367 at 54 MHz, radio sources discussed in the text are highlighted. White and cyan regions were used to measure the total and disk flux densities, respectively. Bottom panel: Same region at 144 MHz, also displaying the XMM-Newton X-ray contours of Ge et al. (2019), contours are [5, 10, 20, 40] counts s−1 deg−2. The purple region marks the detected ICM shock.
Current usage metrics show cumulative count of Article Views (full-text article views including HTML views, PDF and ePub downloads, according to the available data) and Abstracts Views on Vision4Press platform.
Data correspond to usage on the plateform after 2015. The current usage metrics is available 48-96 hours after online publication and is updated daily on week days.
Initial download of the metrics may take a while.