Open Access
Fig. B.1.
Download original image
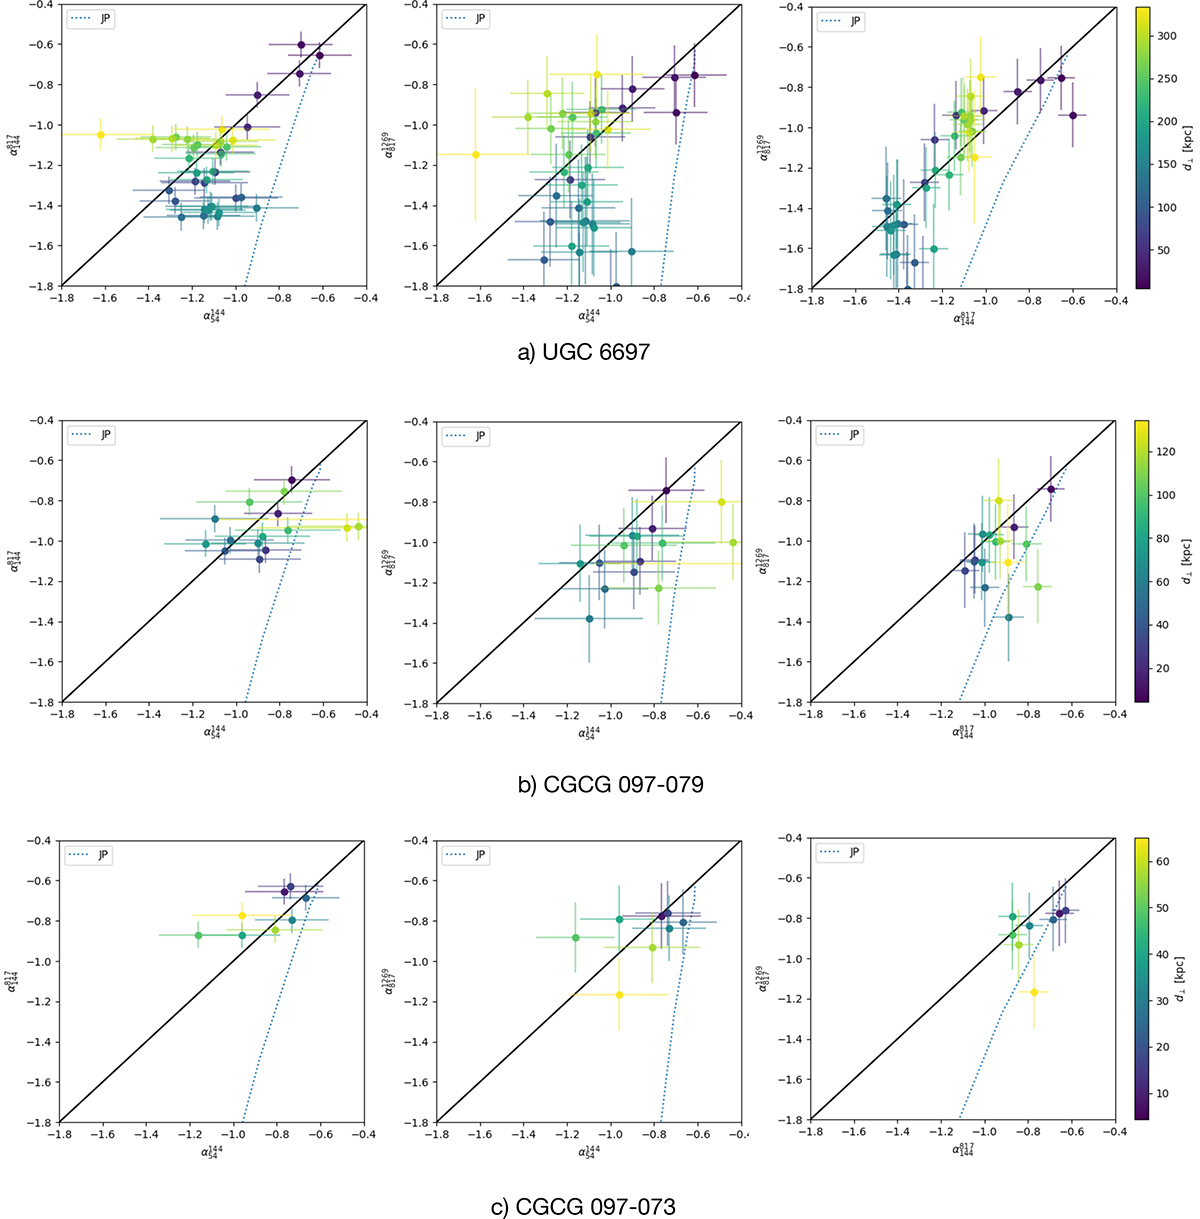
Color-color plots showing ![]() vs.
vs. ![]() (left column),
(left column), ![]() vs.
vs. ![]() (mid column), and
(mid column), and ![]() vs.
vs. ![]() (right column) for the three galaxies (rows). The color of the points corresponds to the projected distance along the tails. The black line shows the power-law scenario and the dotted blue line the JP aging model.
(right column) for the three galaxies (rows). The color of the points corresponds to the projected distance along the tails. The black line shows the power-law scenario and the dotted blue line the JP aging model.
Current usage metrics show cumulative count of Article Views (full-text article views including HTML views, PDF and ePub downloads, according to the available data) and Abstracts Views on Vision4Press platform.
Data correspond to usage on the plateform after 2015. The current usage metrics is available 48-96 hours after online publication and is updated daily on week days.
Initial download of the metrics may take a while.