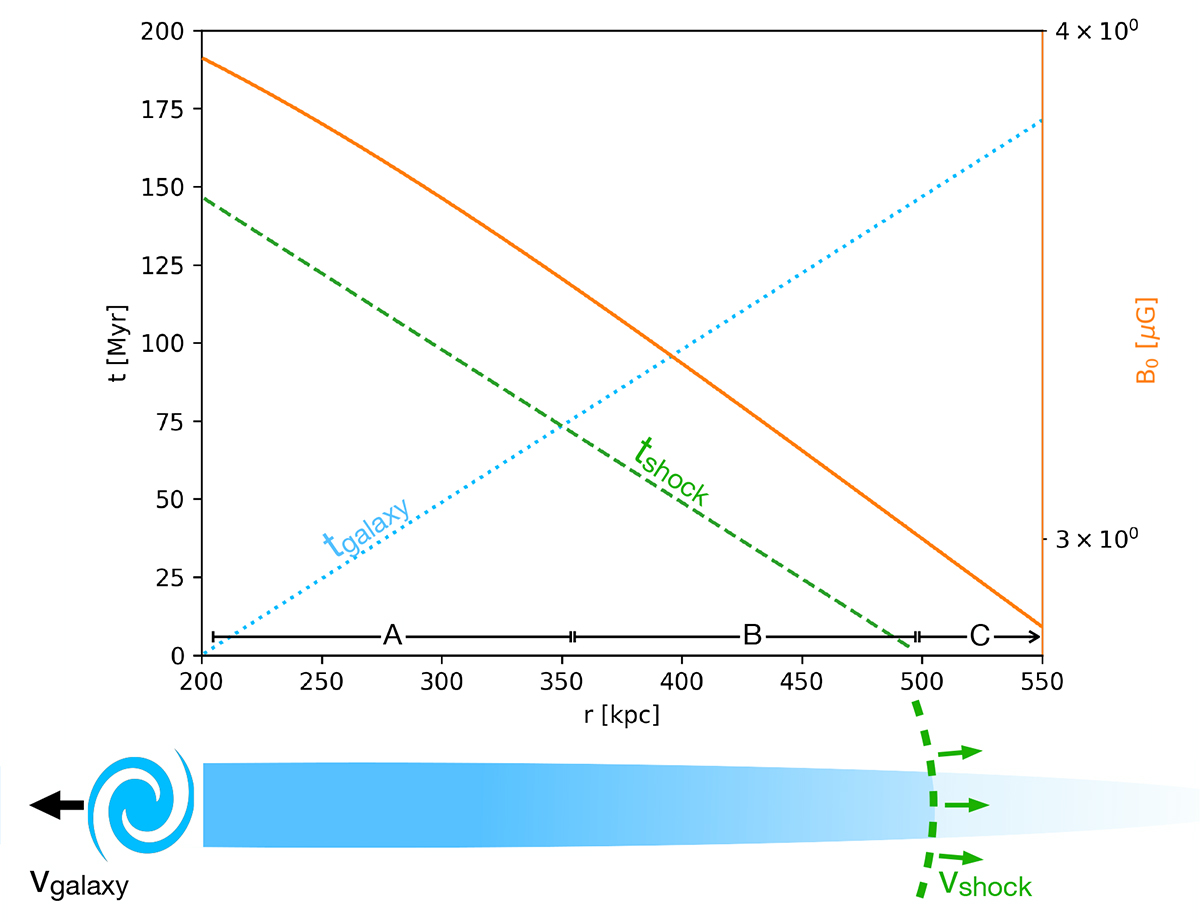
Fig. 9.
Download original image
Time since the galaxy (blue) and shock (green) passed at a radius of r (left y axis). The right y axis shows the magnetic field (orange) as function of radius. The sketch below highlights the present situation, with the galaxy propagating to the left and the shock front to the right. Regions A, B, and C correspond to those defined in Sect. 4.2.
Current usage metrics show cumulative count of Article Views (full-text article views including HTML views, PDF and ePub downloads, according to the available data) and Abstracts Views on Vision4Press platform.
Data correspond to usage on the plateform after 2015. The current usage metrics is available 48-96 hours after online publication and is updated daily on week days.
Initial download of the metrics may take a while.