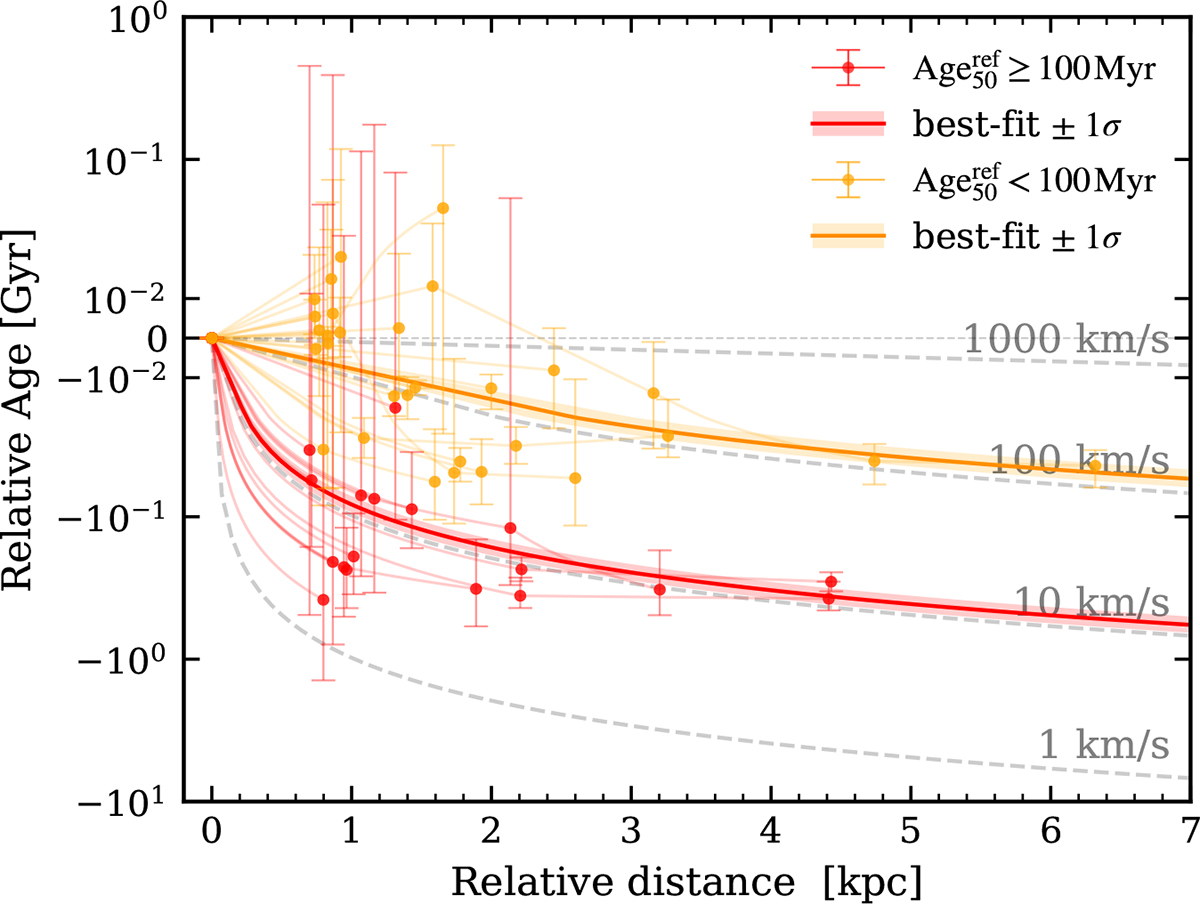
Fig. 10.
Download original image
Age distribution of clump associations as a function of relative distance. For each group, the x-axis shows the projected distance of each clump from the reference clump (i.e. the one closest to the galaxy within that group). The y-axis shows the age of the clumps, from which is subtracted the age of the reference clump of each association. Negative values indicate younger clumps farther away from the galaxy (relative to their group). Associations are divided into two categories: in red, those for which the reference clump is older than 100 Myr; in orange, those younger than this age. The best fit of each of the two groups with a constant velocity relation is shown as a continuous line. Lines at constant velocity are indicated as grey dashed lines. They do not appear as straight lines due to the symlog scale on the y-axis.
Current usage metrics show cumulative count of Article Views (full-text article views including HTML views, PDF and ePub downloads, according to the available data) and Abstracts Views on Vision4Press platform.
Data correspond to usage on the plateform after 2015. The current usage metrics is available 48-96 hours after online publication and is updated daily on week days.
Initial download of the metrics may take a while.