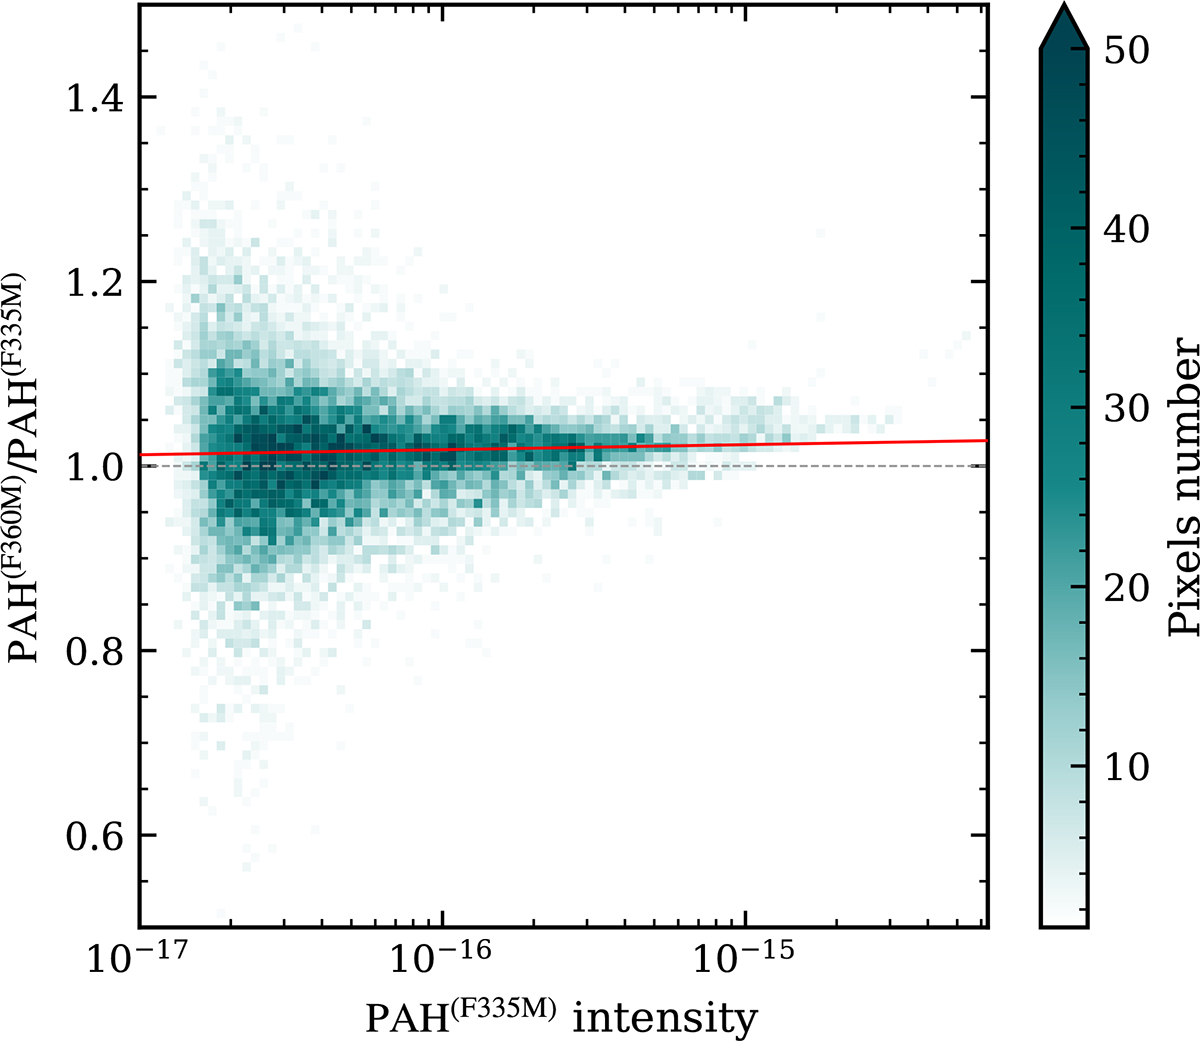
Fig. C.2.
Download original image
Ratio between the PAH3.3 flux emasured using F360M and F480M vs F335M and F480M for continuum modelisation. The ratio is measured pixel by pixel for all the 5σ pixels in the maps of the galaxies analysed in this work. On the x-axis, the PAH3.3 intensity measured using the F335M-F480M continuum is reported. The dashed grey line is the constant unitary line. The red line is the best fit of the points in the graph.
Current usage metrics show cumulative count of Article Views (full-text article views including HTML views, PDF and ePub downloads, according to the available data) and Abstracts Views on Vision4Press platform.
Data correspond to usage on the plateform after 2015. The current usage metrics is available 48-96 hours after online publication and is updated daily on week days.
Initial download of the metrics may take a while.