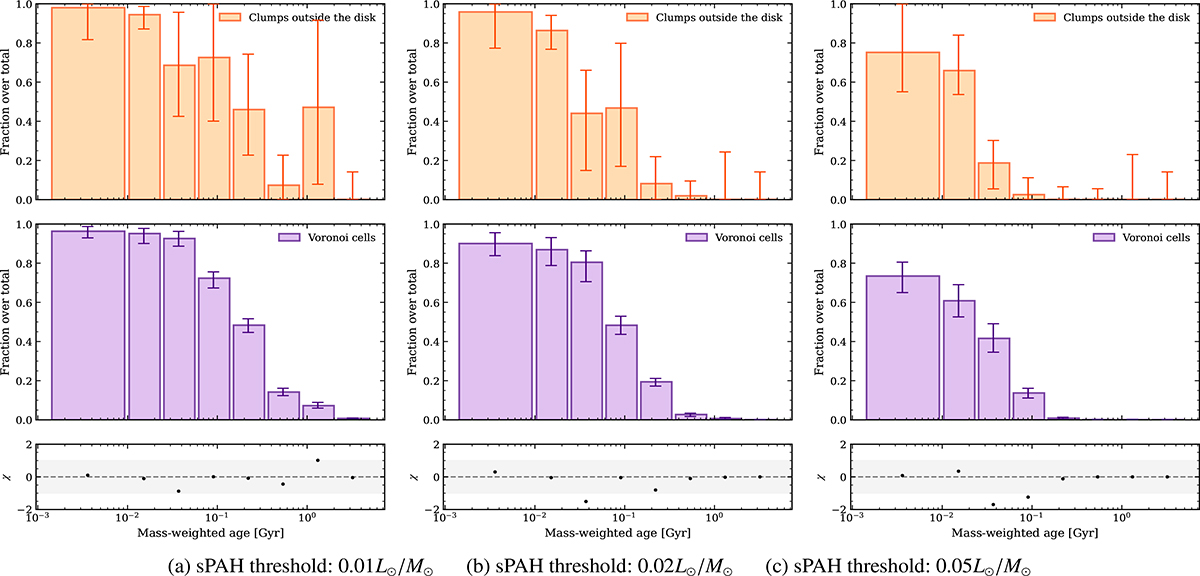
Fig. D.1.
Download original image
Fraction of regions that are strong PAH emitters as a function of the mass-weighted median age. Panels (a)–(c) show the results obtained using different thresholds to define strong PAH emission. For each threshold, the top panel displays the fraction computed for the clumps in the wake, the middle panel shows the same fraction computed on the Voronoi cells within the galaxy that are not associated with any clump, and the bottom panel highlights the differences between the two distributions, normalised by the uncertainty. The grey shaded area indicates the 1σ confidence region.
Current usage metrics show cumulative count of Article Views (full-text article views including HTML views, PDF and ePub downloads, according to the available data) and Abstracts Views on Vision4Press platform.
Data correspond to usage on the plateform after 2015. The current usage metrics is available 48-96 hours after online publication and is updated daily on week days.
Initial download of the metrics may take a while.