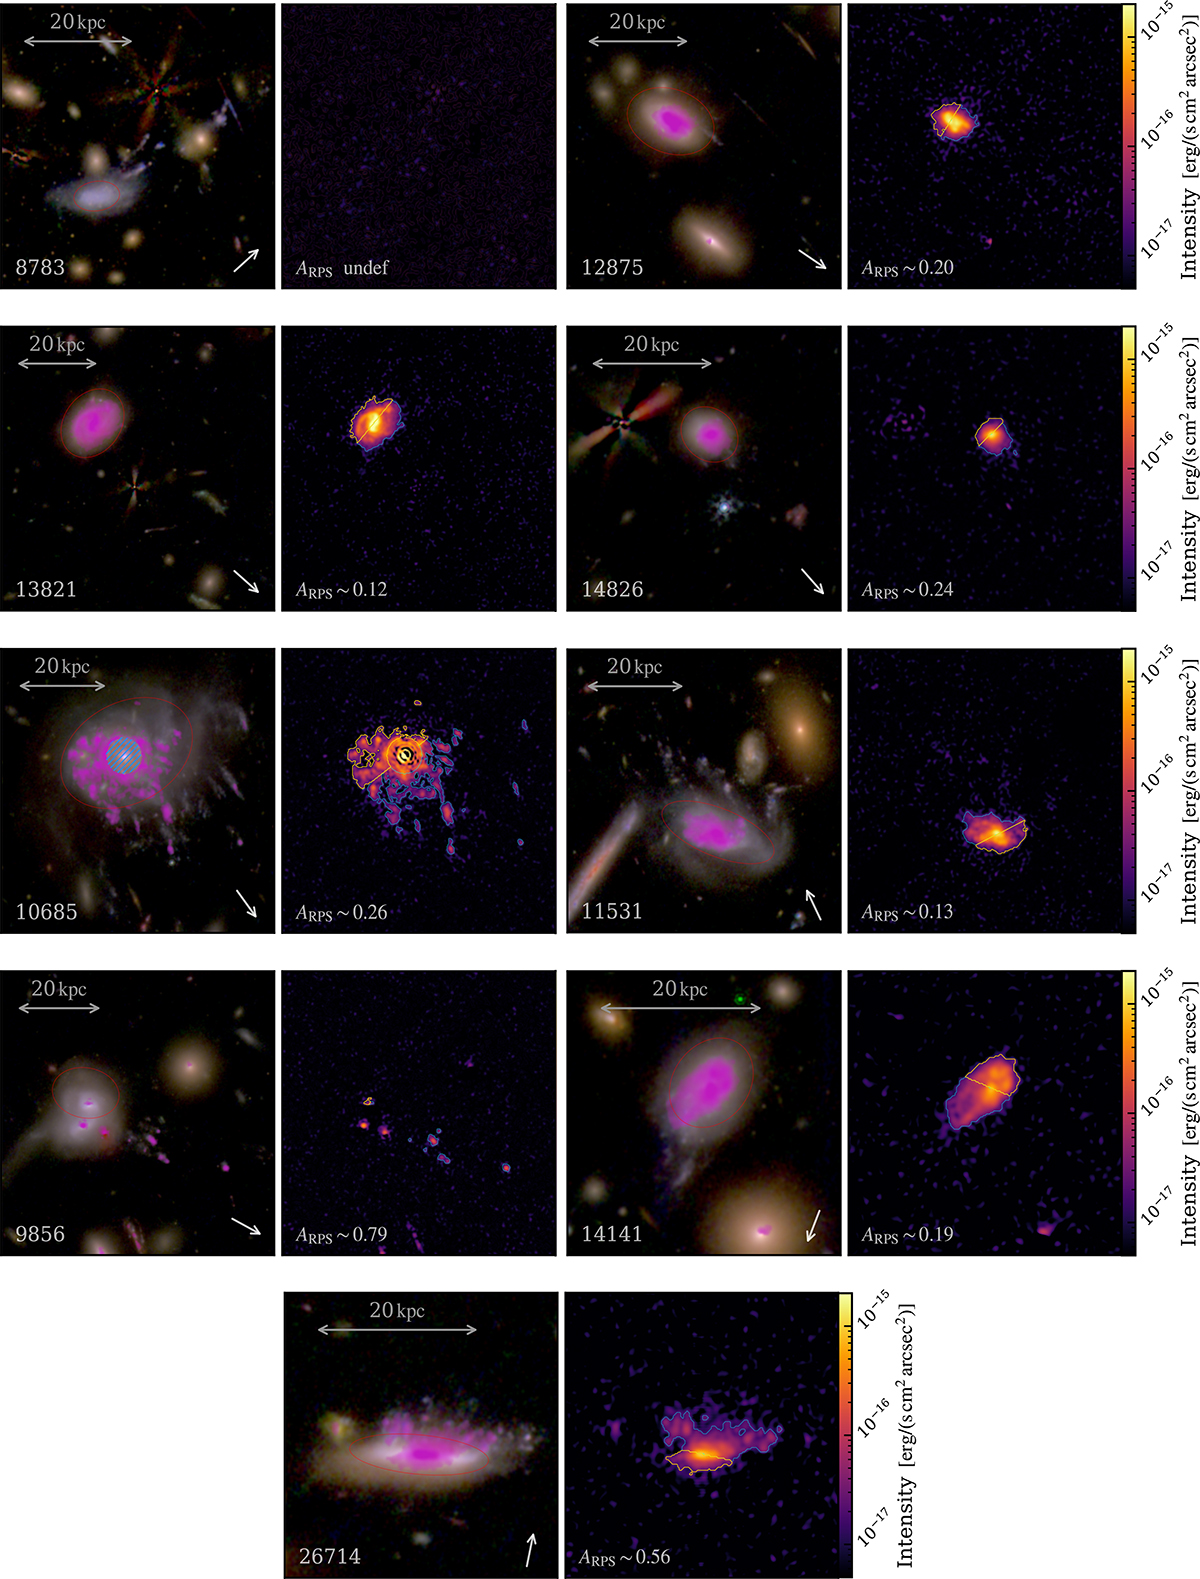
Fig. 5.
Download original image
PAH3.3 emission maps for all galaxies in the sample. For each galaxy, an RGB image composite of F070W (blue), F115W (green), and F200W (red) filters with the 5σ significance PAH map of the galaxy (superimposed in purple) is shown on the left. The red ellipses indicate the galaxy disks. The arrow indicates the RPS direction. The surface brightness map of the PAH3.3 emission is shown on the right. The gold and blue contours indicate the leading and trailing galactic regions with brightness greater than 5σbkg, respectively. The ARPS is the ram pressure asymmetry of the PAH map as defined in Sect. 4.1.1. The blue hatched region in galaxy 10685 represents the masked area. North is up, east is left.
Current usage metrics show cumulative count of Article Views (full-text article views including HTML views, PDF and ePub downloads, according to the available data) and Abstracts Views on Vision4Press platform.
Data correspond to usage on the plateform after 2015. The current usage metrics is available 48-96 hours after online publication and is updated daily on week days.
Initial download of the metrics may take a while.