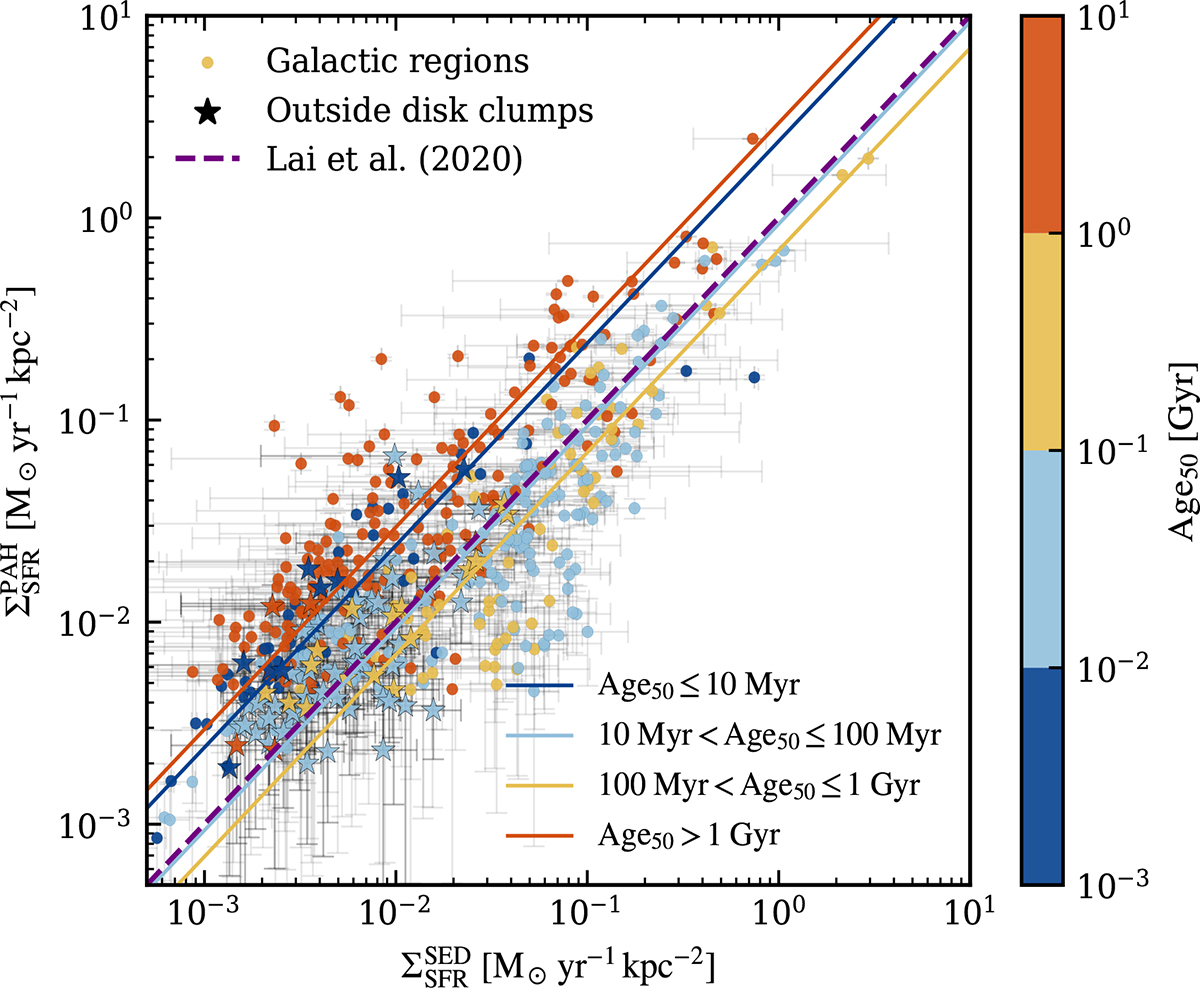
Fig. 8.
Download original image
Comparison between the SFR surface density from the SED fitting (on the x-axis, averaged on 100 Myr) and the one inferred from the PAH luminosity (y-axis). Points are colour-coded by their mass-weighted median age. The circles represent Voronoi cells that are not overlapped with any clump, while the stars indicate clumps outside the galactic disks. We kept only the measurements for which the uncertainty on the SFR is less than 1 dex on both axes. The blue dashed line indicates the 1:1 relation. The coloured lines represent the fit of the data for each age bin.
Current usage metrics show cumulative count of Article Views (full-text article views including HTML views, PDF and ePub downloads, according to the available data) and Abstracts Views on Vision4Press platform.
Data correspond to usage on the plateform after 2015. The current usage metrics is available 48-96 hours after online publication and is updated daily on week days.
Initial download of the metrics may take a while.