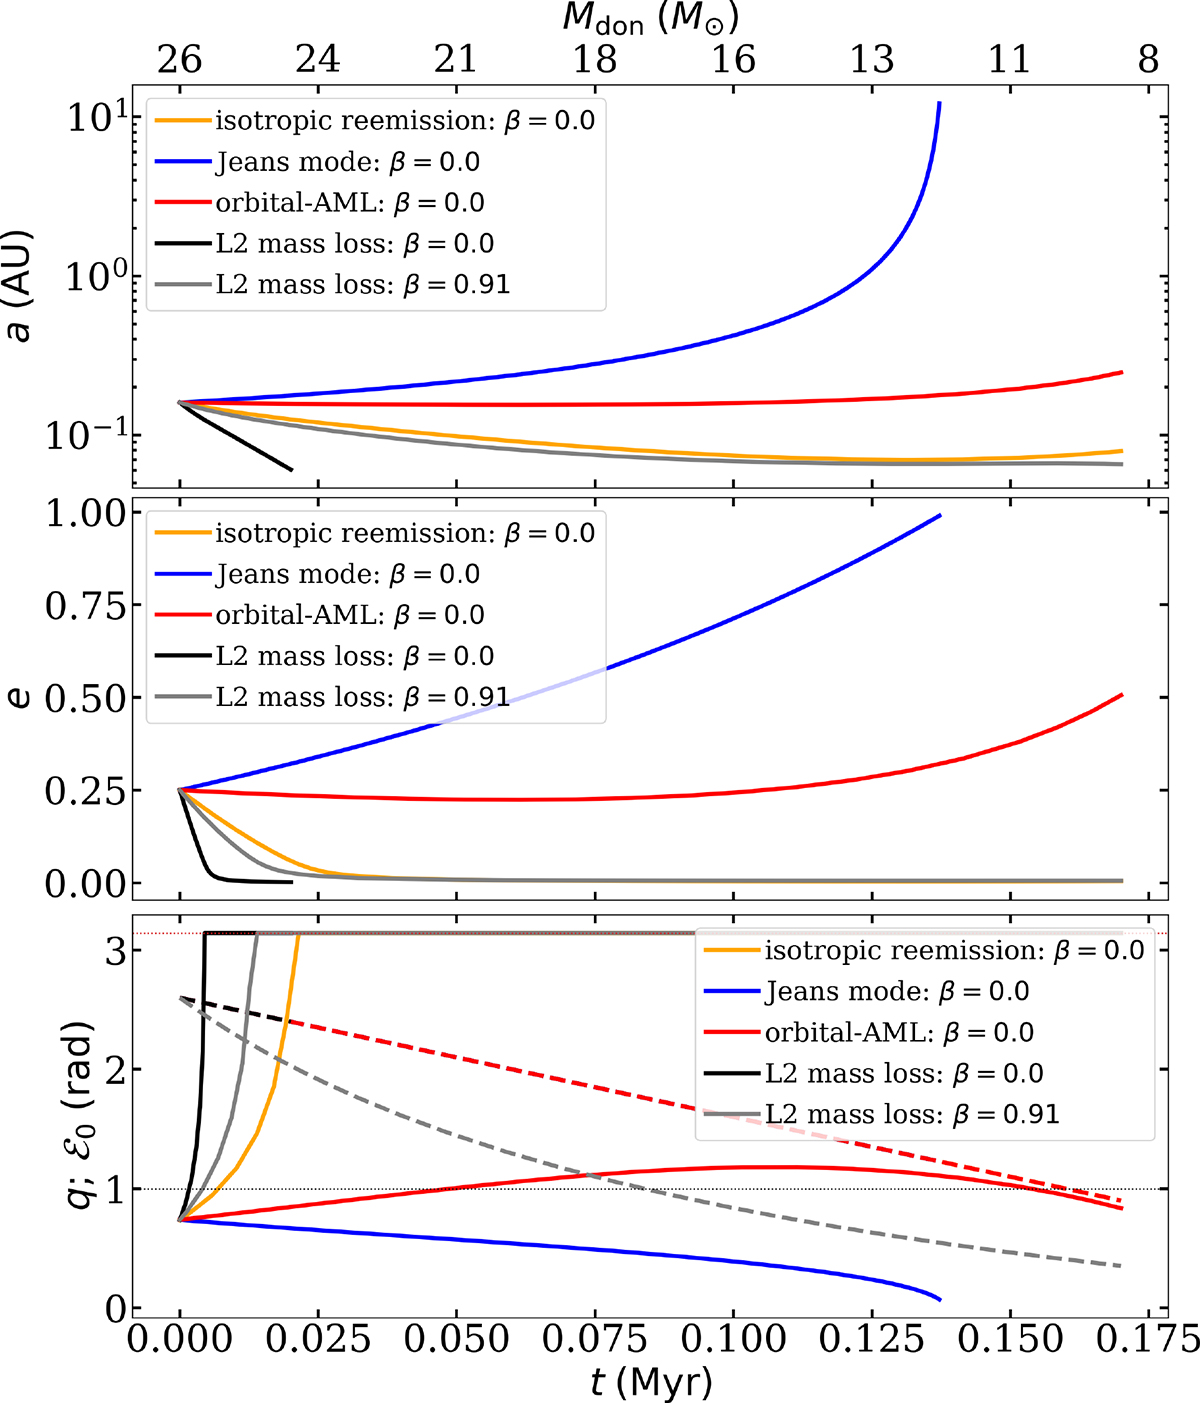
Fig. 10.
Download original image
Evolution of the semimajor axis (top), eccentricity (middle), and both the mass ratio q and angle ℰ (bottom) as a function of time for different AML modes for our example model of a 26 M⊙ donor with a 10 M⊙ accreting BH companion (point-mass limit). The orange, blue, and red lines correspond to the isotropic reemission, Jeans, and orbital-AML modes, respectively. The black and gray lines represent the L2 mass-loss mode for β = 0 (fully nonconservative MT) and β = 0.91 (highly conservative MT), respectively. For all models fdon = 1. In the bottom subfigure, the two horizontal dotted lines indicate ℰ0 = π and q = 1.
Current usage metrics show cumulative count of Article Views (full-text article views including HTML views, PDF and ePub downloads, according to the available data) and Abstracts Views on Vision4Press platform.
Data correspond to usage on the plateform after 2015. The current usage metrics is available 48-96 hours after online publication and is updated daily on week days.
Initial download of the metrics may take a while.