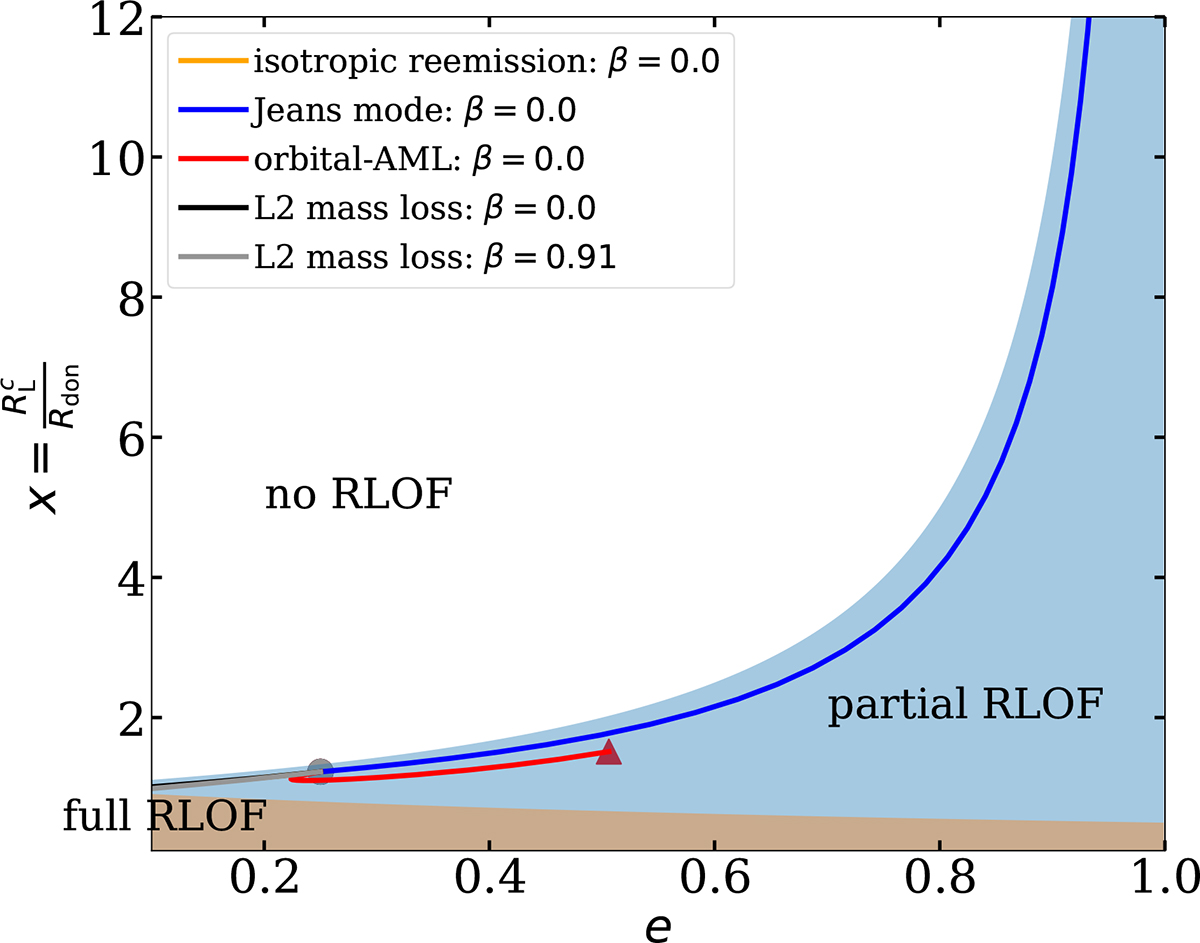
Fig. 11.
Download original image
Graphical representation of the mass-transfer regimes. The white region indicates no mass transfer, i.e., the system is detached. The light blue region corresponds to partial RLOF, where mass transfer occurs during part of the orbit. The light-brown region represents full RLOF, with continuous mass transfer throughout the entire orbit. The orange, blue, and red lines correspond to the isotropic reemission, Jeans, and orbital-AML modes, respectively. The black and gray lines represent the L2 mass-loss mode for β = 0 (fully nonconservative MT) and β = 0.91 (highly conservative MT), respectively. The circles and triangles indicate the initial and final positions of the systems, respectively. The final position for the blue line is x ≈ 80, but we limited the y-axis for visualization purposes.
Current usage metrics show cumulative count of Article Views (full-text article views including HTML views, PDF and ePub downloads, according to the available data) and Abstracts Views on Vision4Press platform.
Data correspond to usage on the plateform after 2015. The current usage metrics is available 48-96 hours after online publication and is updated daily on week days.
Initial download of the metrics may take a while.