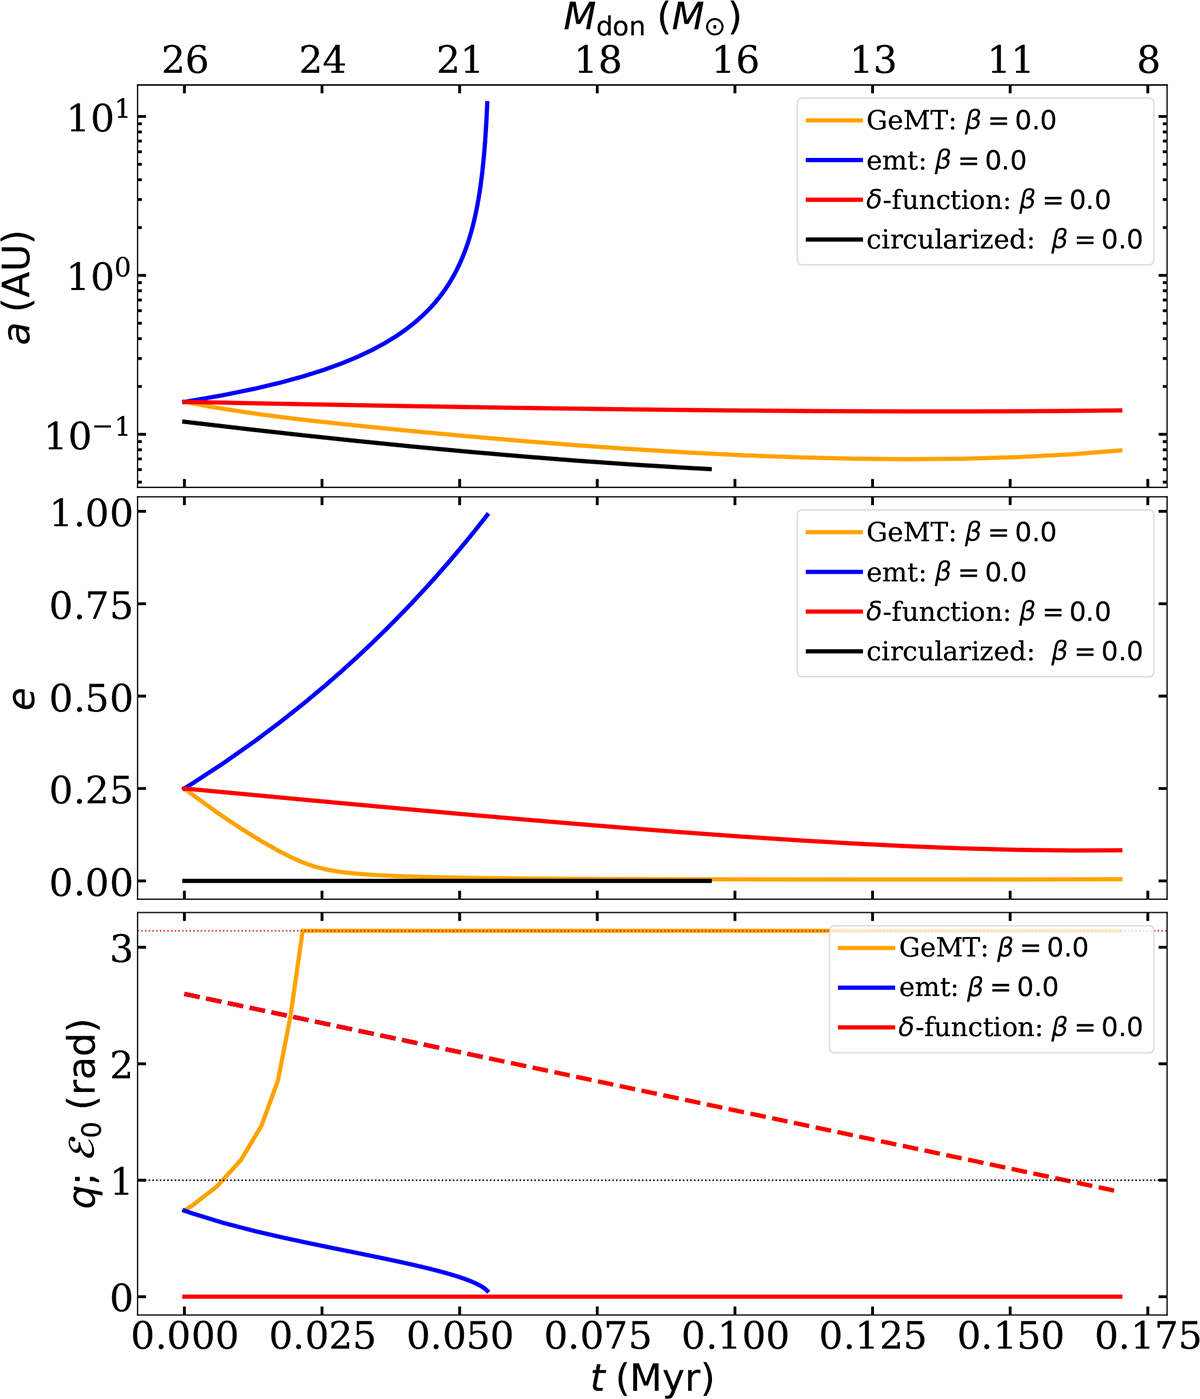
Fig. 13.
Download original image
Similar to Fig. 10, but the lines now correspond to different MT frameworks assuming isotropic reemission. The orange, blue, and red lines correspond to the GeMT, the emt, and the δ-function models, respectively. The black line illustrates the classical RLOF model, meaning instantaneous circularization at periastron acirc = a(1 − e) = 0.12 au and point masses.
Current usage metrics show cumulative count of Article Views (full-text article views including HTML views, PDF and ePub downloads, according to the available data) and Abstracts Views on Vision4Press platform.
Data correspond to usage on the plateform after 2015. The current usage metrics is available 48-96 hours after online publication and is updated daily on week days.
Initial download of the metrics may take a while.