Fig. A.1.
Download original image
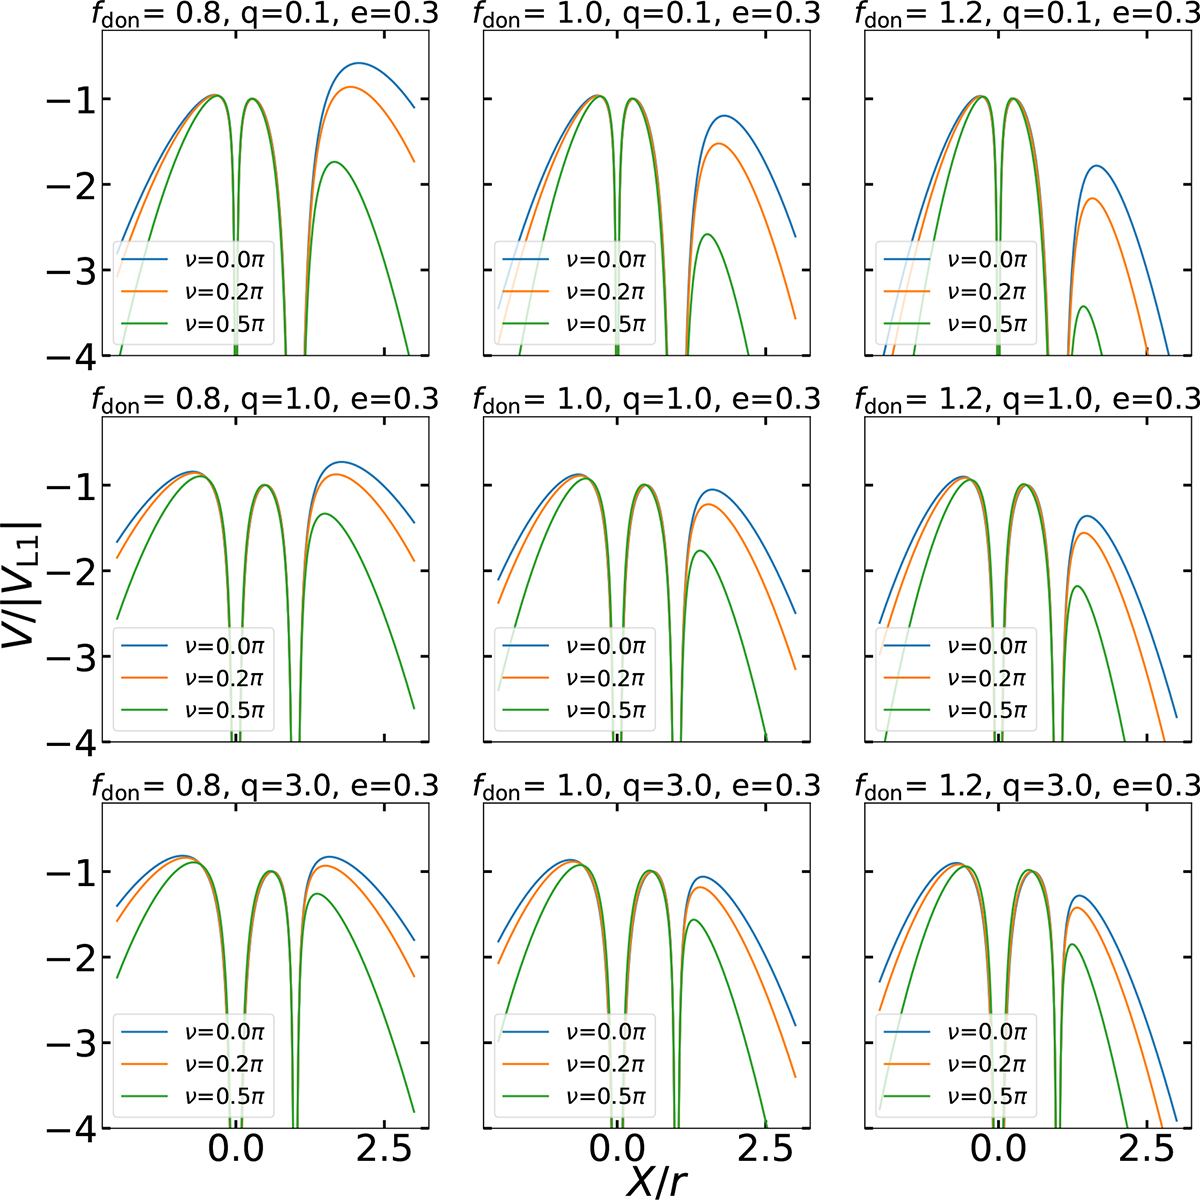
Height of the potential V along the axis connecting centers of mass of the binary components (X-axis). The potential is normalized to its value at the inner Lagrangian point L1. For all models e = 0.3. The blue, orange, and green lines correspond to orbital phases ν = 0.0π, π/4, and π/2, respectively. From top to bottom, the subfigures correspond to q = 0.1, 1.0, and 3.0, respectively. From left to right, the subfigures correspond to fdon = 0.8, 1.0, and 1.2, respectively.
Current usage metrics show cumulative count of Article Views (full-text article views including HTML views, PDF and ePub downloads, according to the available data) and Abstracts Views on Vision4Press platform.
Data correspond to usage on the plateform after 2015. The current usage metrics is available 48-96 hours after online publication and is updated daily on week days.
Initial download of the metrics may take a while.