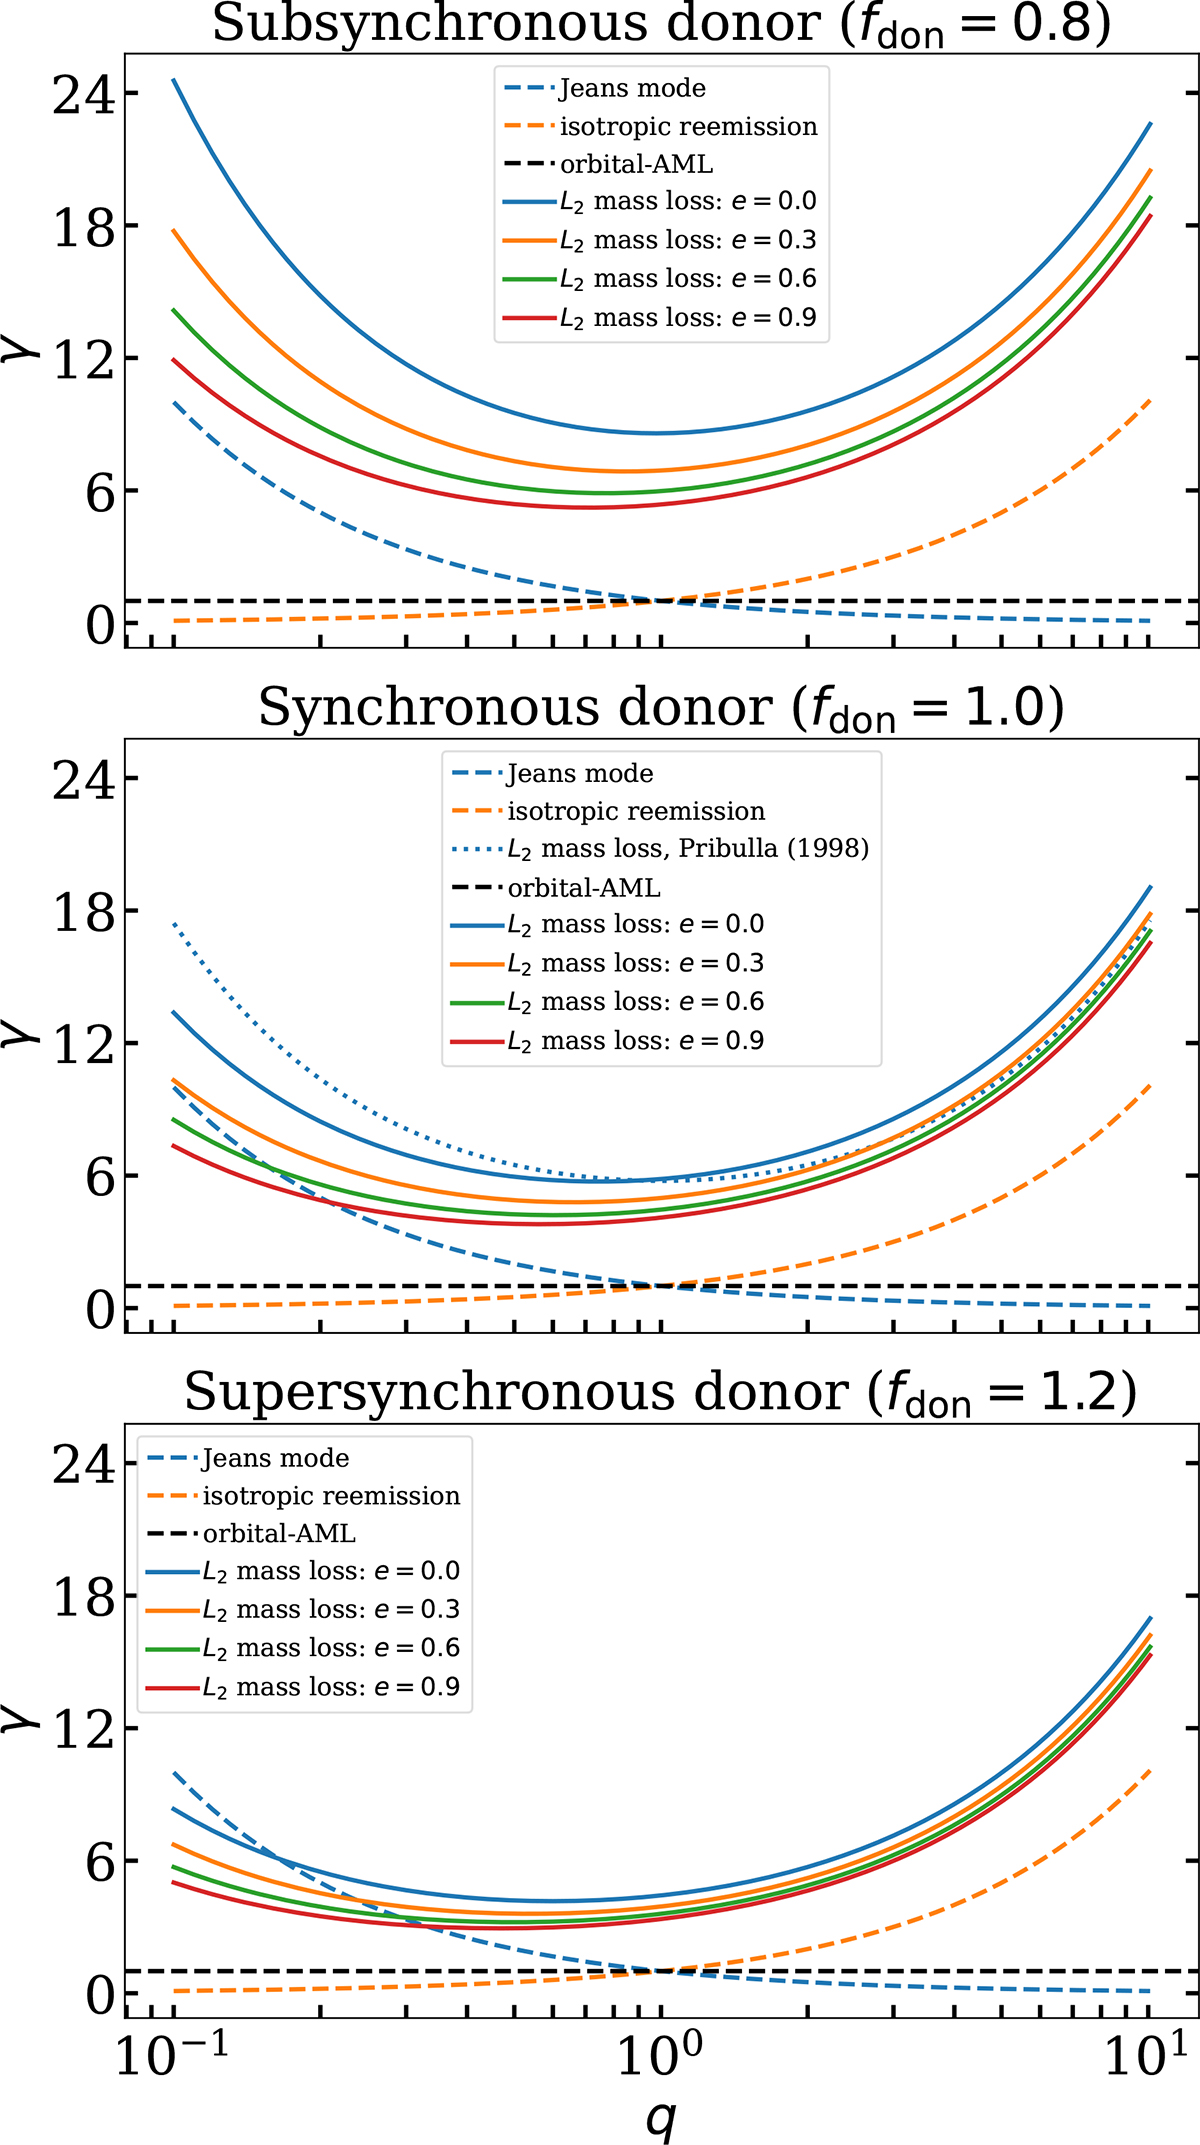
Fig. 3.
Download original image
AML-parameter γ for different angular momentum loss modes. From top to bottom, the subfigures correspond to fdon = 0.8, 1.0, and 1.2, respectively. Dashed blue, orange, and black lines correspond to Jeans, isotropic reemission, and orbital-AML modes, respectively. Solid lines represent the L2 mass-loss mode (Eq. 8). Blue, orange, green, and red colors correspond to e = 0.0, 0.3, 0.6, and 0.9, respectively. The dotted blue line corresponds to L2 mass-loss mode for circular orbits (Pribulla 1998).
Current usage metrics show cumulative count of Article Views (full-text article views including HTML views, PDF and ePub downloads, according to the available data) and Abstracts Views on Vision4Press platform.
Data correspond to usage on the plateform after 2015. The current usage metrics is available 48-96 hours after online publication and is updated daily on week days.
Initial download of the metrics may take a while.