Fig. 10
Download original image
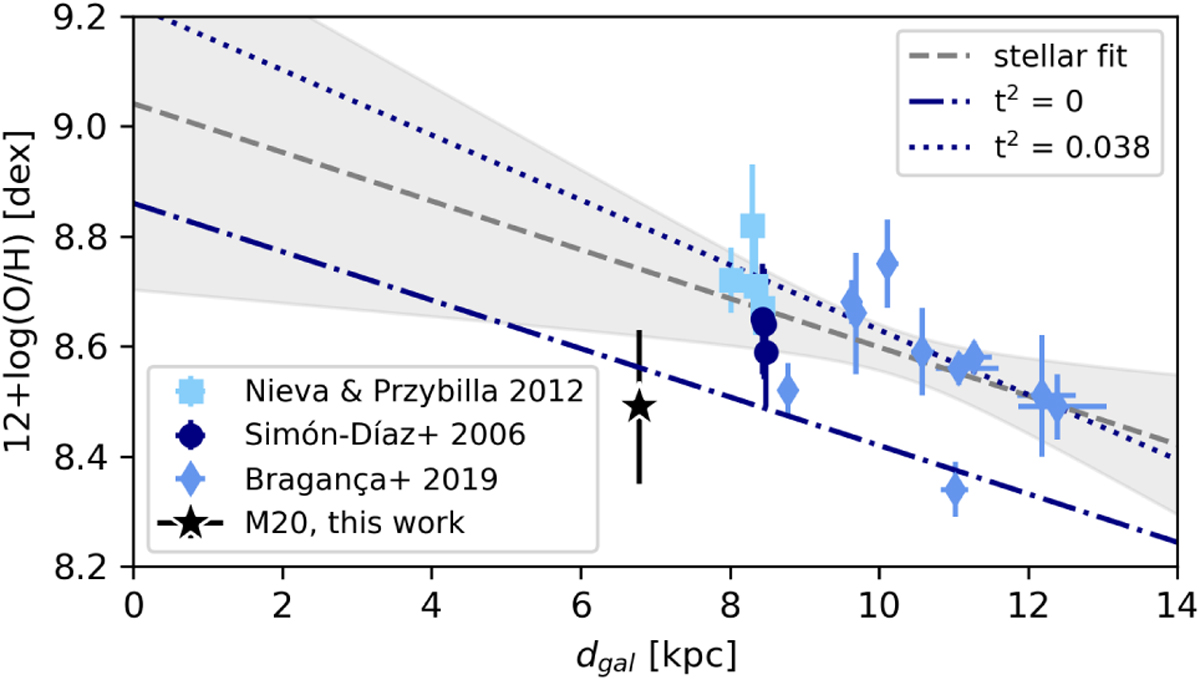
Oxygen abundance trend calculated from B V-stellar measurements by Simón-Díaz et al. (2006); Nieva & Przybilla (2012); Bragança et al. (2019). The fit is illustrated by a grey dashed line, whereas the shaded region indicates the 3σ uncertainty of the fit. Fits from Méndez-Delgado et al. (2022a) for t2=0 and t2=0.038 are shown as dark blue dash-dotted and dotted lines, respectively. The position of the nebular oxygen abundance of M 20 calculated in this work (8.49 ± 0.14, from the integrated view) is indicated by the black star.
Current usage metrics show cumulative count of Article Views (full-text article views including HTML views, PDF and ePub downloads, according to the available data) and Abstracts Views on Vision4Press platform.
Data correspond to usage on the plateform after 2015. The current usage metrics is available 48-96 hours after online publication and is updated daily on week days.
Initial download of the metrics may take a while.