Fig. 2
Download original image
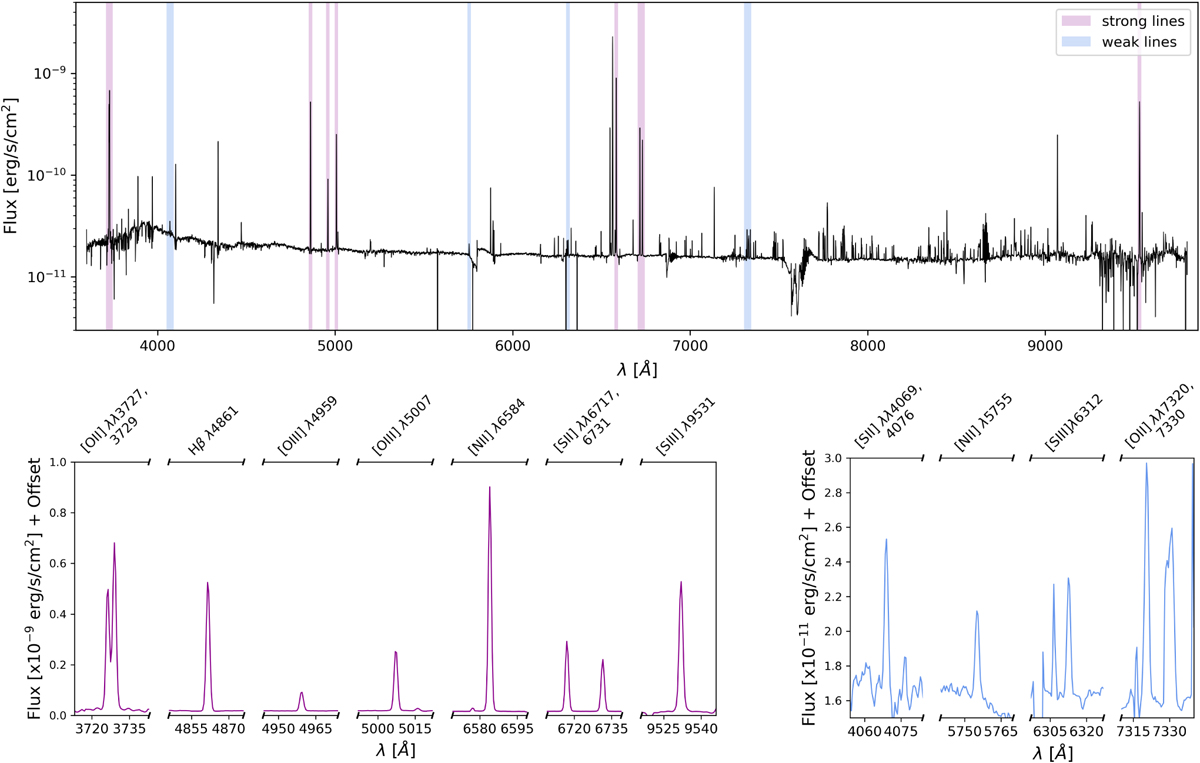
Top: integrated spectrum of the full LVM pointing covering the Trifid Nebula. Bottom: zoom-in collection of strong lines (left: in magenta) and weak auroral lines (right: in blue) taken from the above spectrum, each in a window of 30Å. The Hα emission line is not shown here, as its height would dominate over all other lines.
Current usage metrics show cumulative count of Article Views (full-text article views including HTML views, PDF and ePub downloads, according to the available data) and Abstracts Views on Vision4Press platform.
Data correspond to usage on the plateform after 2015. The current usage metrics is available 48-96 hours after online publication and is updated daily on week days.
Initial download of the metrics may take a while.