Fig. 4
Download original image
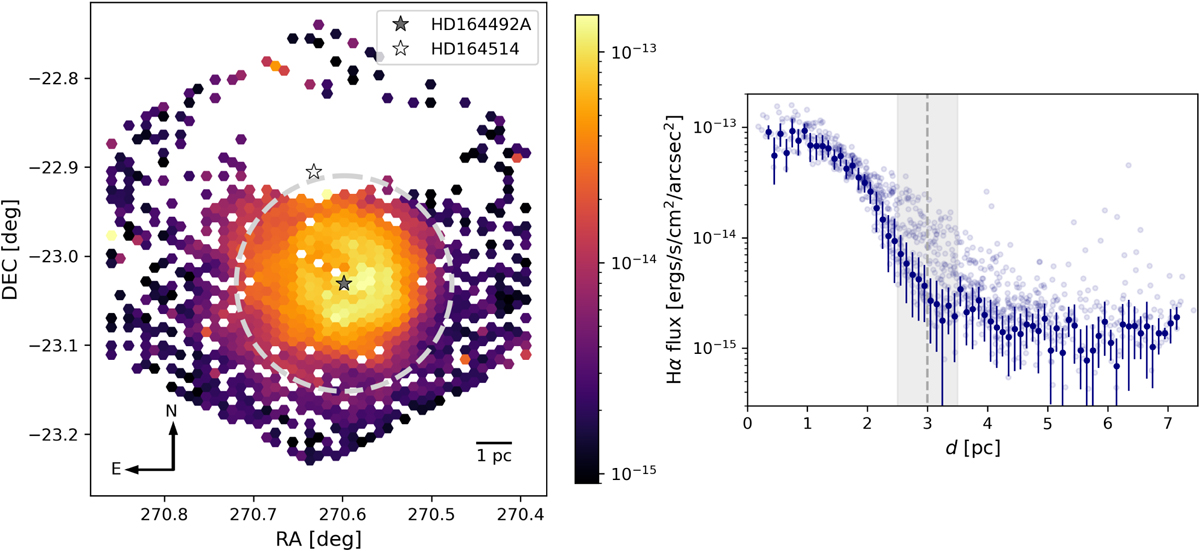
Left: map of the reddening corrected Hα line flux as described in Sect. 3.1. The position of HD 164492A is marked with a grey star, while the position of HD 164514 is marked with a white star. The extent of the measured Strömgren sphere (Sect. 3.4) is shown by a grey dashed circle. Right: radial variation of the reddening corrected Hα line flux as a function of the distance to the ionizing star HD 164492A. Faint points represent individual spaxels, while opaque points show the uncertainty-weighted average of all spaxels within 0.1 pc wide distance bins. Standard deviations are shown as error bars. The extent of the measured Strömgren sphere (Sect. 3.4) is shown by a grey dashed line together with the error as a grey shaded region.
Current usage metrics show cumulative count of Article Views (full-text article views including HTML views, PDF and ePub downloads, according to the available data) and Abstracts Views on Vision4Press platform.
Data correspond to usage on the plateform after 2015. The current usage metrics is available 48-96 hours after online publication and is updated daily on week days.
Initial download of the metrics may take a while.